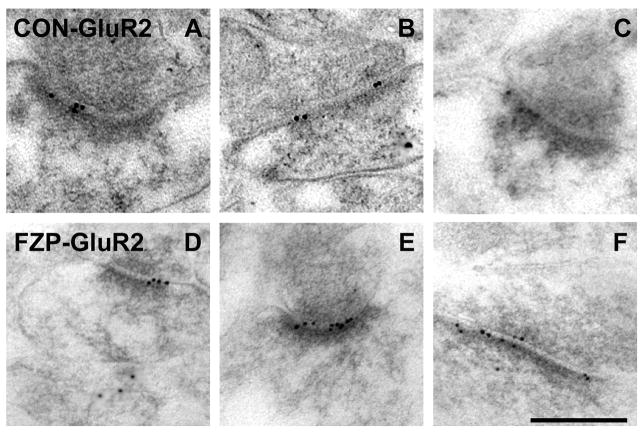
Figure 4.
Electron micrographs of AMPAR GluR2 subunit immunogold labeling in hippocampal CA1 SR from control and FZP-withdrawn rats. (A-C) Representative images of GluR2-labeled (Chemicon) asymmetric synapses from control rats show immunogold particles (10 nm) mainly in the postsynaptic density and extending into the synaptic cleft. (D-F) GluR2 immunogold labeling was unchanged between control and FZP-withdrawn CA1 neuron synapses (see Table 1 and Fig. 5). Scale bar in F is 0.25 μm. All images are at the same magnification.

