
Figure 5.
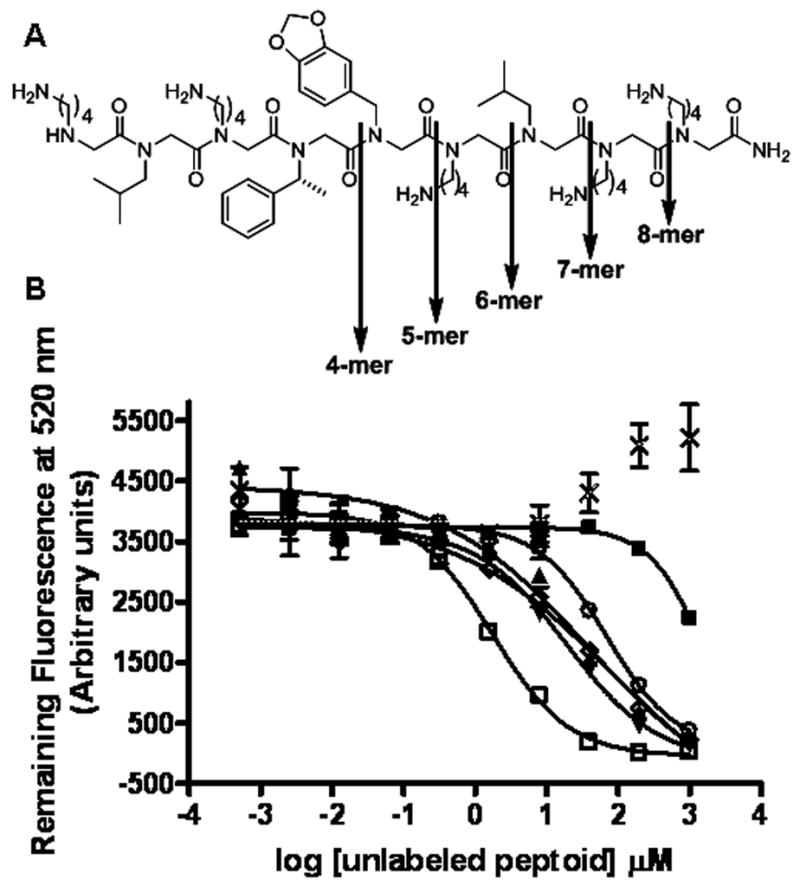
GU40C truncation study results. (A) Downward arrows show GU40C truncation positions (B) Competitive binding assay results; increasing concentrations of unlabelled GU40C and truncated derivatives were competed with a constant amount of fluoraceinated GU40C. Symbols represent; GU40C (□), 8-mer (▲), 7-mer (▼), 6-mer (◇), 5-mer (○), 4-mer (■), control (×).