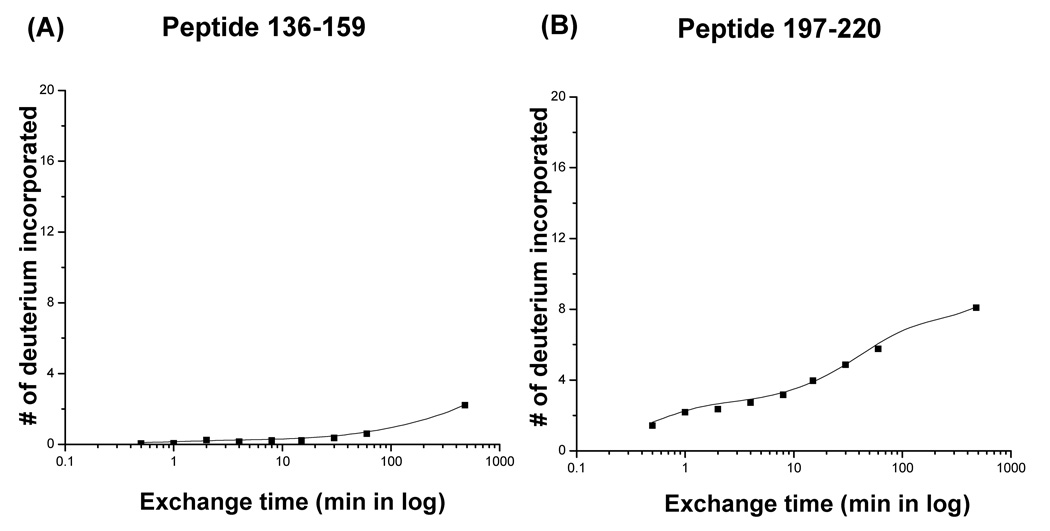
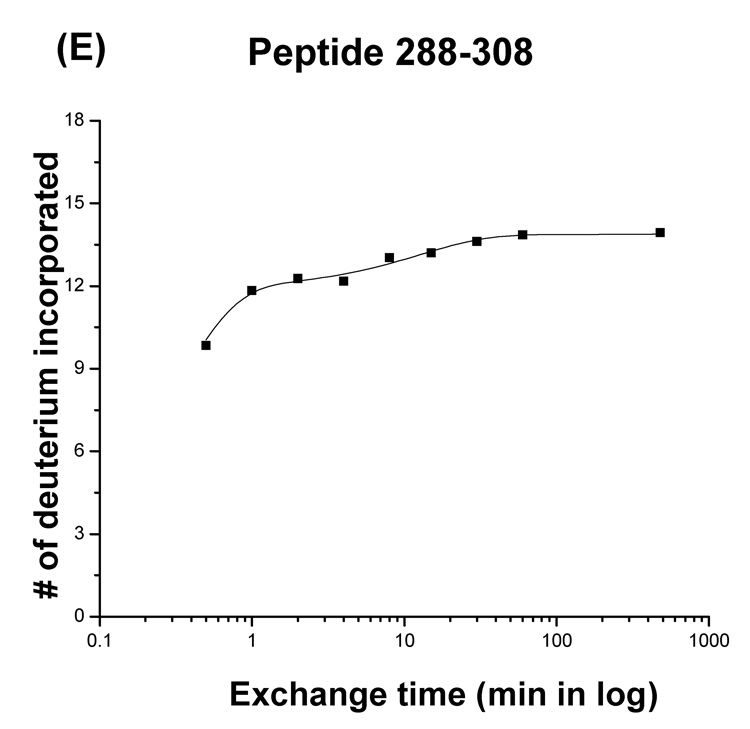
Figure 3.
Plots of the number of deuterium atoms incorporated according to the exchange period for peptic fragments from the Phi29 portal complexes (dots). The solid line represents the fit obtained by three component exponential fitting the exchange data (see materials and methods). Peptic fragments (A) 136–159, (B) 197–220, (C) 160–185, (D) 1–13, and (E) 288–308. Highest number on the y-axis represents the theoretical number of exchangeable amide protons.


