
Figure 2. Neuropathological correlates of behavioral phenotype in tumor-bearing lewis rats 5 days after treatment with Ad-Flt3L and Ad-tK, or with saline.
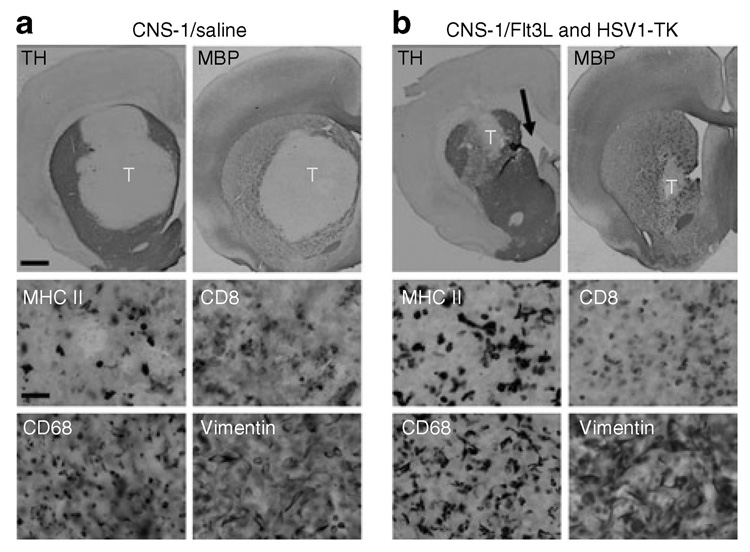
(a) Representative brain sections from animals depicted in Figure 1a stained for tyrosine hydroxylase (TH) and myelin basic protein (MBP) reveals that CNS-1 tumor growth displaces nerve terminals (TH+) and axon bundles (MBP+) within the striata of tumor-bearing animals that had been treated with an intratumoral injection of saline 3 days earlier. The lack of TH and MBP immunoreactivity of CNS-1 tumor cells results in a well-delineated tumor mass (labeled “T”). High-magnification images taken within the tumor mass reveal a high level of immune cell infiltration including cells expressing major histocompatibility class II (MHC II), CD8 + T cells (CD8), and macrophages/microglia (CD68). CNS-1 cells were identified using vimentin staining. (b) Treatment with Ad-Flt3L- and Ad-TK-induced tumor regression and, as a result, such animals show a smaller area of striatal disruption of TH+ axons and myelin (MBP+) 3 days after treatment. Enlargement of the ventricles ipsilateral to the tumor-injected hemisphere (black arrow) is observed as early as 5 days after treatment. High-magnification images taken within the tumor mass reveal a high level of immune cell infiltration including cells expressing MHC II+, CD8 + T cells (CD8), and macrophages/ microglia (CD68). CNS-1 cells were identified using vimentin staining. Scale bars represent 1,000 and 50 µm, respectively. Ad, adenovirus; Flt3L, Fms-like tyrosine kinase 3 ligand; HSV1-TK, herpes simplex virus type 1 thymidine kinase.