Fig. 2.
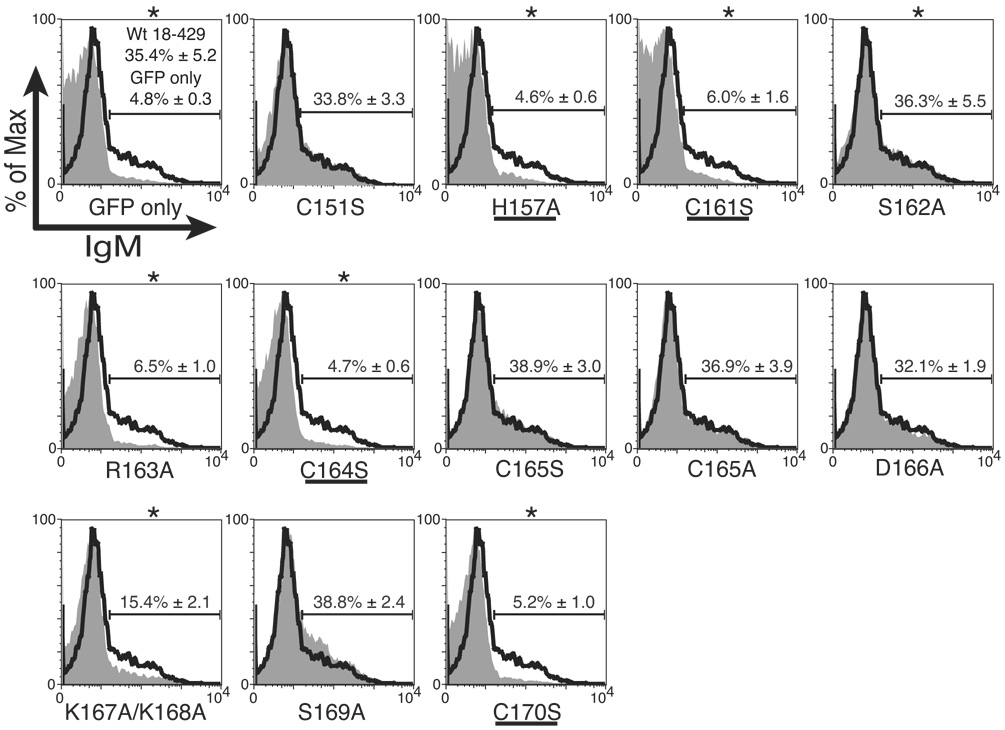
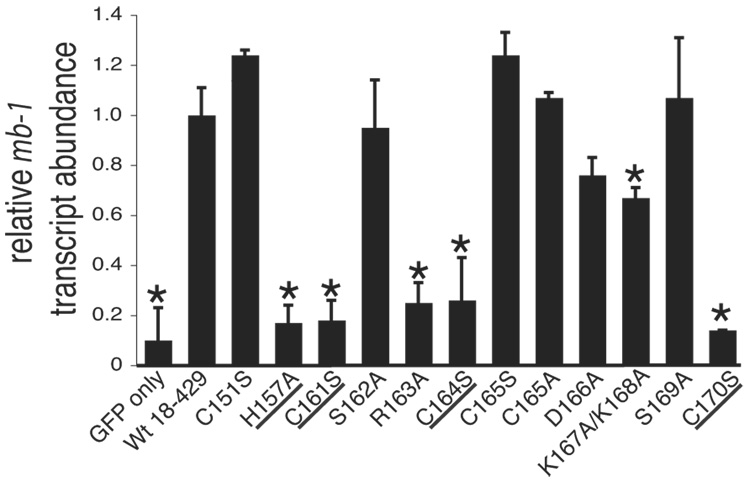
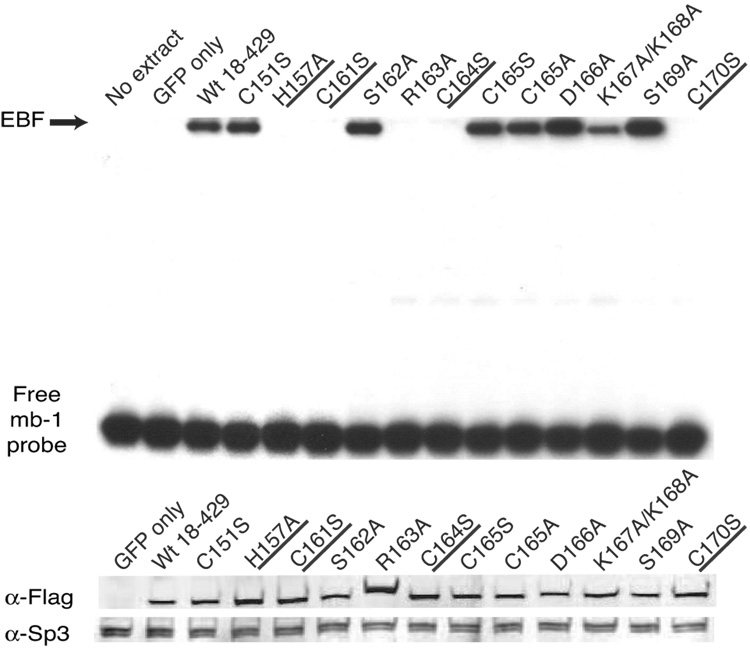
Analysis of mb-1 gene expression and EBF DNA binding: Zn knuckle mutations. (A) Representative mIgM expression on µM.2.21 cells retrovirally infected to express empty vector/mutant EBF. Histograms indicate the percentage of GFP+ cells that display mIgM (% of max versus mIgM expression). Mean detection of mIgM+ cells (gated relative to GFP only controls) of three independent experiments is indicated in each box. Mutations that disrupt zinc binding are underlined. In this and subsequent figures, flow data marked with an * indicate a Student’s t test of p ≤ 0.05. (B) Quantitative real-time PCR (qPCR) of mb-1 mRNA isolated from infected GFP+ µM.2.21 cells infected to express wild type or mutated EBF proteins. Data include mean +/− s.d. of three independent experiments. All values were normalized to endogenous β-actin mRNA expression. Amounts of mb-1 transcripts from cells expressing empty vector were set to one for these experiments. (C) Binding of the mb-1 probe by wild type and mutated EBF proteins in nuclear extracts of infected cells. Top: EMSA was performed using the previously reported murine mb-1 promoter EBF site (mb-1) probe (Maier et al., 2004). Bottom: Western blotting of FLAG-tagged EBF and endogenous Sp3 (loading control) expressed in µM.2.21 cells.


