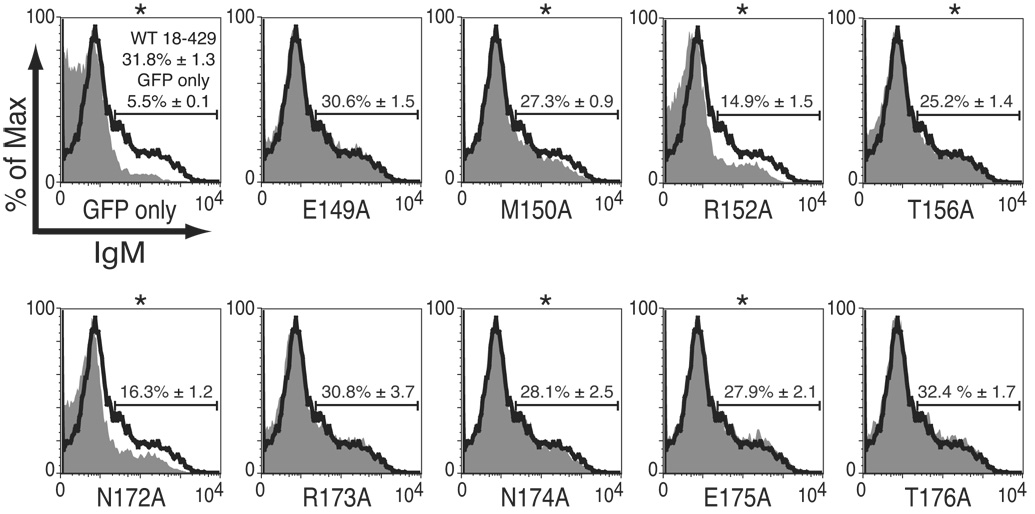
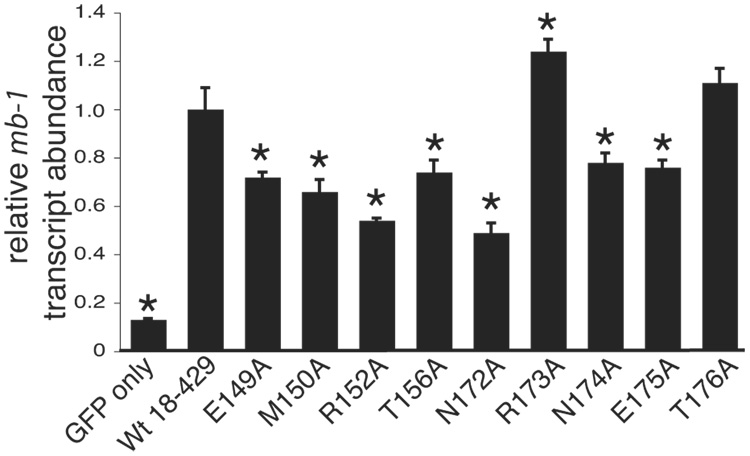
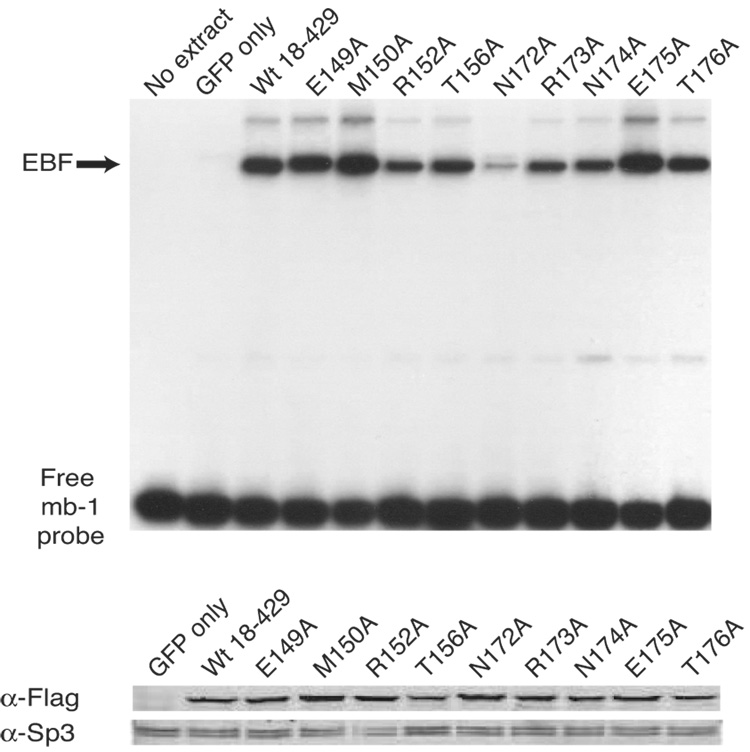
Fig. 4.
Analysis of mb-1 gene expression and EBF DNA binding: mutations of flanking residues. (A) mIgM expression on retrovirally infected βM.2.21 cells. Presentation is identical with Fig.2A. Mean activation of mIgM expression (relative to GFP only control) from three independent experiments is indicated in each box. (B) qPCR of mb-1 mRNA isolated from µM.2.21 cells infected to express wild type or mutated EBF in (A). Other aspects of these experiments (n = 3) are similar to Fig.2B. (C) EBF DNA binding. Top: Binding of the mb-1 probe by wild type and mutated EBF. Bottom: Western blotting of FLAG-tagged EBF or endogenous Sp3 (loading control) expressed in µM.2.21 cells. Other aspects of these experiments are similar to Fig.2C.


