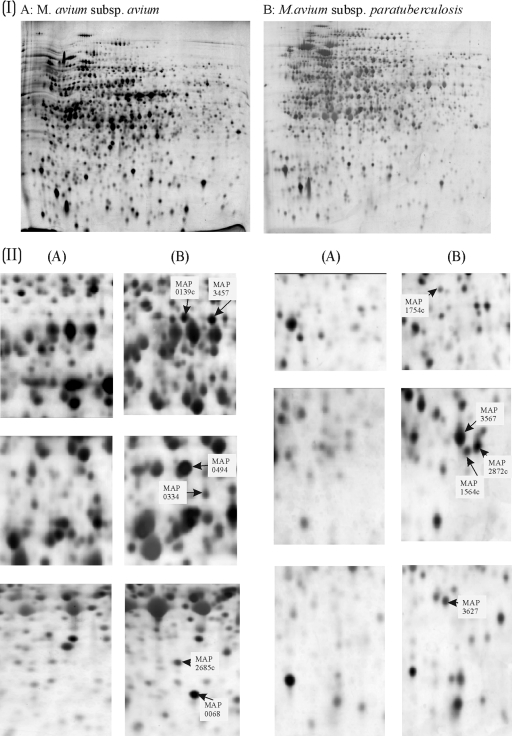
FIG. 1.
(I) Proteomic comparison of M. avium subsp. paratuberculosis and M. avium subsp. avium cultured in Middlebrook 7H9 broth. Silver-stained 2-D electrophoretograms of M. avium subsp. avium (A) and M. avium subsp. paratuberculosis (B) are shown. The organisms used to generate proteomes were grown in Middlebrook 7H9 broth and harvested during exponential phase. (II) Magnification of areas of the proteomic profiles showing proteins that are specific or predominant in M. avium subsp. paratuberculosis. Composites of analogous regions of 2-D electrophoretograms of either M. avium subsp. avium (A) or M. avium subsp. paratuberculosis (B) are presented. Regions of the gels shown in part I are magnified to demonstrate the differences observed. This figure was compiled by using Phoretix 2D Elite (part I) and CorelDraw 9 software (parts I and II).

