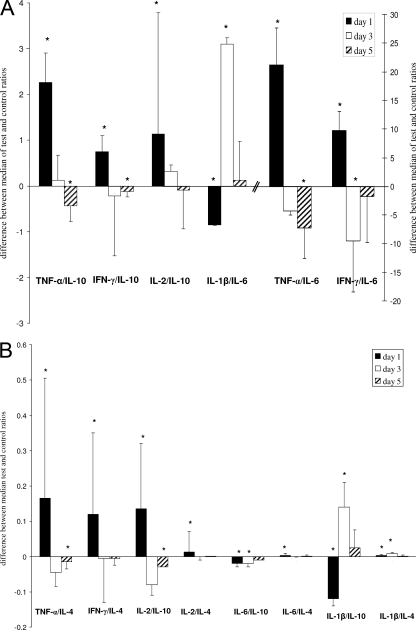
FIG. 2.
Differences in median cytokine ratios in the test mice and the control mice, where the median control ratios are zeros on the y axis. (A) Ratios that differed by >1; (B) ratios that differed by <1. Each bar represents the values for four test mice compared to the values for four control mice at that time point. Black bars, white bars, and bars with slanted black lines, data for day 1, day 3, and day 5 postinfection, respectively (*, P < 0.05, Mann-Whitney U test). Error bars represent ranges (maximum or minimum test value minus median control value).

