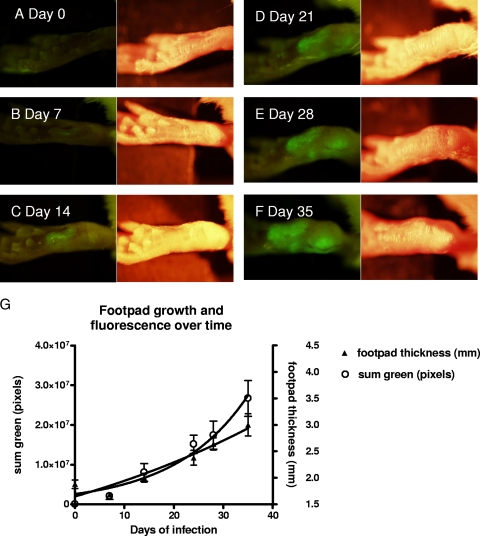
FIG. 1.
Photographs of a mouse footpad over time after inoculation with 107 egfp-transfected L. amazonensis promastigotes. (A to F) On each pair of photographs, the left image was taken using the fluorescence imaging system, while the right image was taken using normal bright-field imaging. The images were taken at 7-day intervals, as indicated in the figure, with the day 0 photograph taken just prior to inoculation. Photographs were taken using the OV-100 imaging system (Olympus, Tokyo, Japan). Five mice were used in this experiment, and one representative mouse was chosen for all of the photographs. (G) Graph of the mean footpad measurement in mm (right axis) with standard error over the course of the Leishmania infection (solid triangles). On the same graph, the mean of the sum green pixel count (open circles) with standard error from images taken at serial time points is plotted as well (left axis). GFP fluorescence, indicating infection, was visualized when the first set of images was taken at day 7. A significant difference in the mean measurements between day 0 and each time point was not reached until day 24 (P = 0.011).

