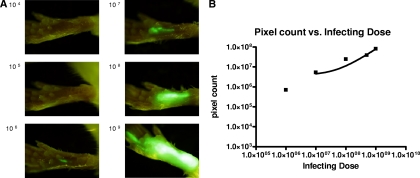
FIG. 4.
(A) Images taken 2 h after inoculation with increasing numbers of egfp-transfected L. amazonensis parasites. (B) Graph of pixel counts of green fluorescence against the number of Leishmania parasites inoculated, showing the relationship between infecting dose and pixel count (r = 0.9798 by the Pearson method). The solid line represents the best-fit curve using linear regression.

