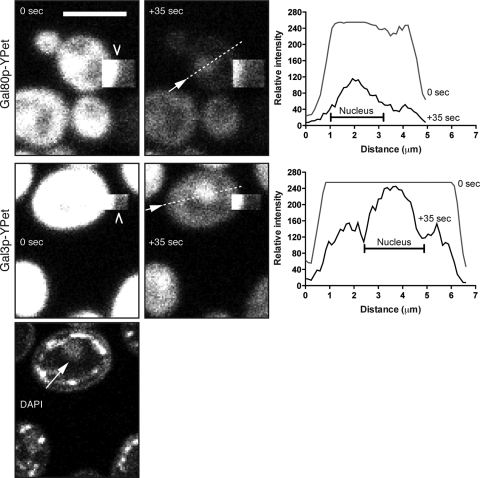
FIG. 2.
Cytoplasmic bleaching of Gal80p-YPet and Gal3p-YPet grown in galactose. Shown are images at 0 s and +35 s for both fusions. The bleached area is a square box (barbed arrowhead) that borders the yeast cell. For Gal3p-YPet, the DAPI channel is included and shows the position of the nucleus (arrow). The graphs show profile plots at 0 s and at +35 s of a line taken through the cell at the positions shown in the +35-s images (dashed line and arrow). Bars = 5 μm.

