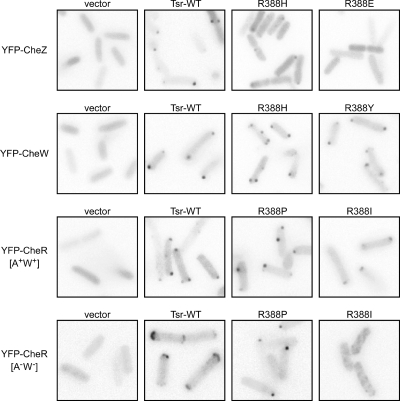
FIG. 3.
Examples of clustering phenotypes of Tsr-R388* and Tsr-E391* mutants. Each image shows an inverted gray-scale portion of the original fluorescence image. A few panels are composites containing images from several areas of the same micrograph. Cells appear as light-gray shapes due to background cytoplasmic fluorescence; the dark spots correspond to receptor clusters. Fluorescent reporters are listed on the left; Tsr mutants or controls are listed above each panel. The host strains (from top to bottom) were RP9352, RP8607, UU1535, and UU1581.

