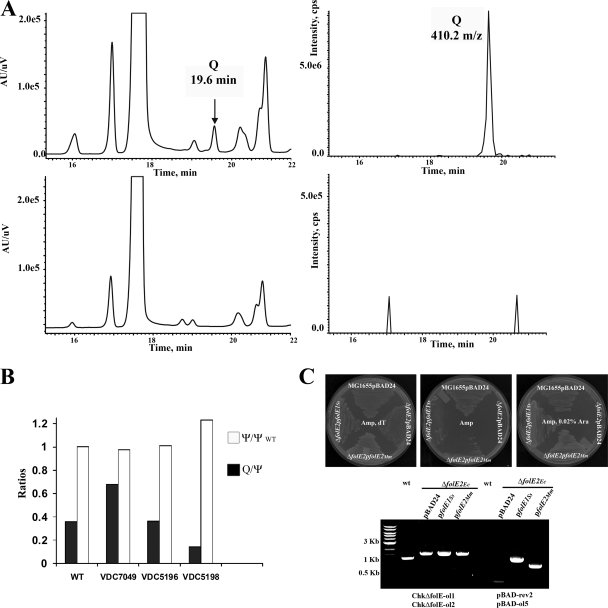
FIG. 4.
(A) Results of LC-MS-MS analysis of E. coli tRNA extracted from different strains. Results for WT (W6) are in upper panels; results for VDC5211 (ΔfolE::Kanr) are in lower panels; the UV traces (left) at 254 nm and the extraction ion chromatograms (right) for 410 m/z are shown. (B) Complementation of the Q− phenotype analyzed by LC-MS-MS. The ratios of Q/Ψ in tRNA extracted from the E. coli ΔfolE::Kanr strains complemented with E. coli folE (VDC7049), B. subtilis folE2 (VDC5196), or M. maripaludis folE2 (VDC5198) are shown by the filled bars. To control for the amount of tRNA, the Ψ content in the complemented strains was compared to the Ψ content in the WT control (white bars). The result of a typical experiment is presented. (C) Upper panel shows results for complementation of the ΔfolE::Kanr strain dT auxotrophy by the archaeal folE genes on LB supplemented with Amp and dT (left plate), LB supplemented with Amp (middle plate), and LB supplemented with Amp and 0.02% arabinose (right plate). The control is ΔfolE::Kanr transformed by pBAD24. The plates were incubated at 37°C for 48 h. Lower panel shows results of PCR amplifications to check for the presence of the ΔfolE::Kanr allele and to check for the presence of an insert of the expected size in the pBAD derivatives (performed as described in Materials and Methods on the ΔfolE::Kanr strain transformed with plasmids expressing M. maripaludis folE2 or S. solfataricus folE or with the pBAD24 control). The expected size of the PCR product from detecting ΔfolE::Kanr is about 1.5 kb, while the same primers amplify a 1.2-kb product in the WT strain.

