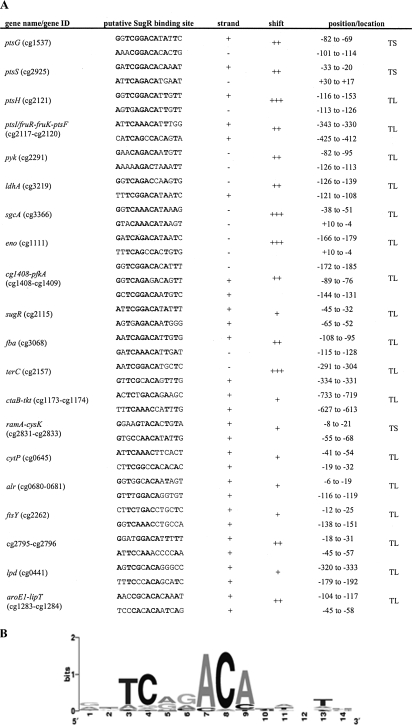
FIG. 3.
SugR binding sites in the DNA fragments verified by band shift analysis. (A) The SugR binding sites shown in this figure were identified by a motif search using the MEME software (http://meme.sdsc.edu/) (4) and the promoter fragments used in the gel shift analysis. The column labeled “shift” indicates whether a complete gel shift occurred at a 30-fold (+++), 60-fold (++), or 90-fold (+) excess of SugR to the corresponding DNA fragments. The positions of the binding sites relative to the transcriptional start site (TS) or the translational start site (TL) are given by the numbers in the “position/location” column. (B) A frequency plot of the deduced consensus sequence conservation at each position of the 14-bp motif, where the height of each symbol within the stack reflects the relative frequency of the corresponding nucleotide at that position.

