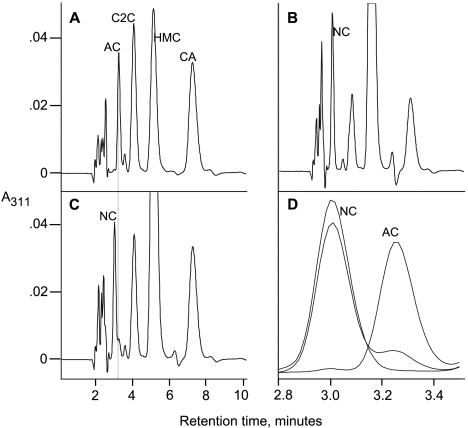
FIG. 5.
HPLC analysis of clavam metabolites produced by the complemented orfC mutant of S. clavuligerus. Wild type (A), orfC mutant (B), complemented orfC mutant (C), and overlay and expansion of panels A to C in the region of retention times from 2.8 to 3.5 min (D) are shown. The faint dotted line indicates the presence of low levels of alanylclavam in the complemented orfC mutant. Abbreviations for metabolite peaks are given in legend to Fig. 3.

