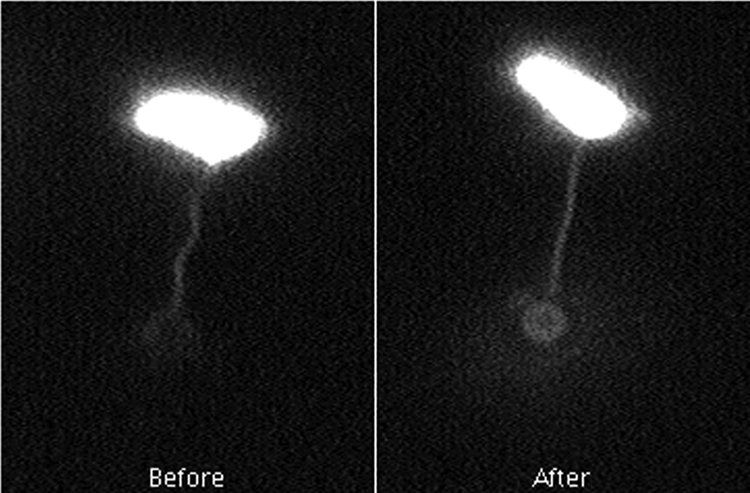
FIG. 1.

Shape change during stretching. The images show a cell before the stretch and a cell after the stretch, just before the bead escaped from the trap. The bead is in better focus in the latter image, where the pitch of the helix is ∼1.35 times normal and the radius of the helix is ∼0.33 times normal. The images are single frames from a video recording.
