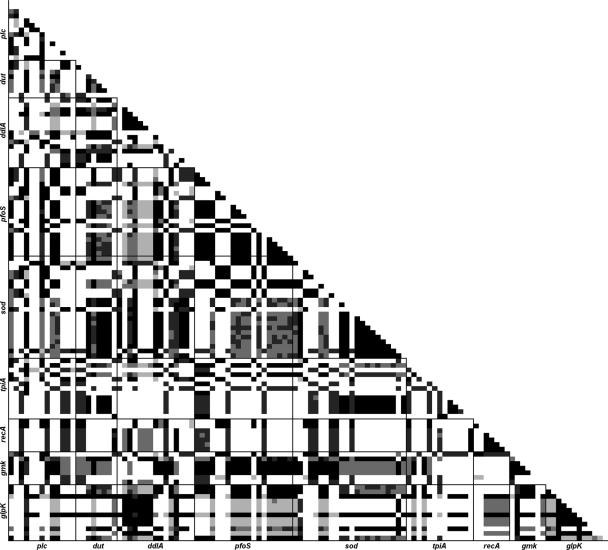
FIG. 2.
Linkage disequilibrium matrix of polymorphic sites in 22 STs, generated by Arlequin version 3.11 (9). Darker cells refer to more-significant P values (black cells represent values of ≤0.05 and the lightest-gray cells up to 0.20). Locus names are shown on each axis, in sequential order on the chromosome.

