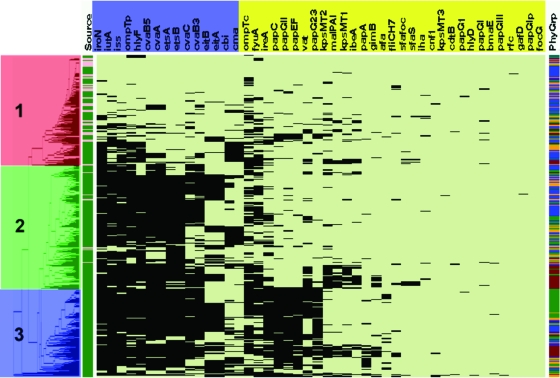
FIG. 2.
Left-most portion of this figure is the dendrogram resulting from the cluster analysis. There appears to be three main clusters of isolates. Cluster 1 (highlighted in red) contains most of the AFEC isolates. The majority of isolates in cluster 2 (highlighted in green) are APEC isolates, and cluster 3 (highlighted in blue) consists entirely of APEC isolates. Just to the right of the dendrogram is column 1, which identifies an isolate as APEC (green) or AFEC (pink). Columns 2 to 47 show the virulence genotype of each isolate tested. Each column in this group shows the results for a single gene or trait. The identity of each gene tested is shown in the horizontal bar at the top of the diagram, with those in blue being plasmid mediated and those in yellow being chromosomally located. Black indicates that a gene is present, and pale green indicates that a gene is absent. Column 48 shows the phylogenetic group of each isolate: blue, group A; orange, B1; brown, B2; and green, D. ompTp, episomal ompT; ompTc, chromosomal ompT; iss, episomal iss.

