
FIG. 3.
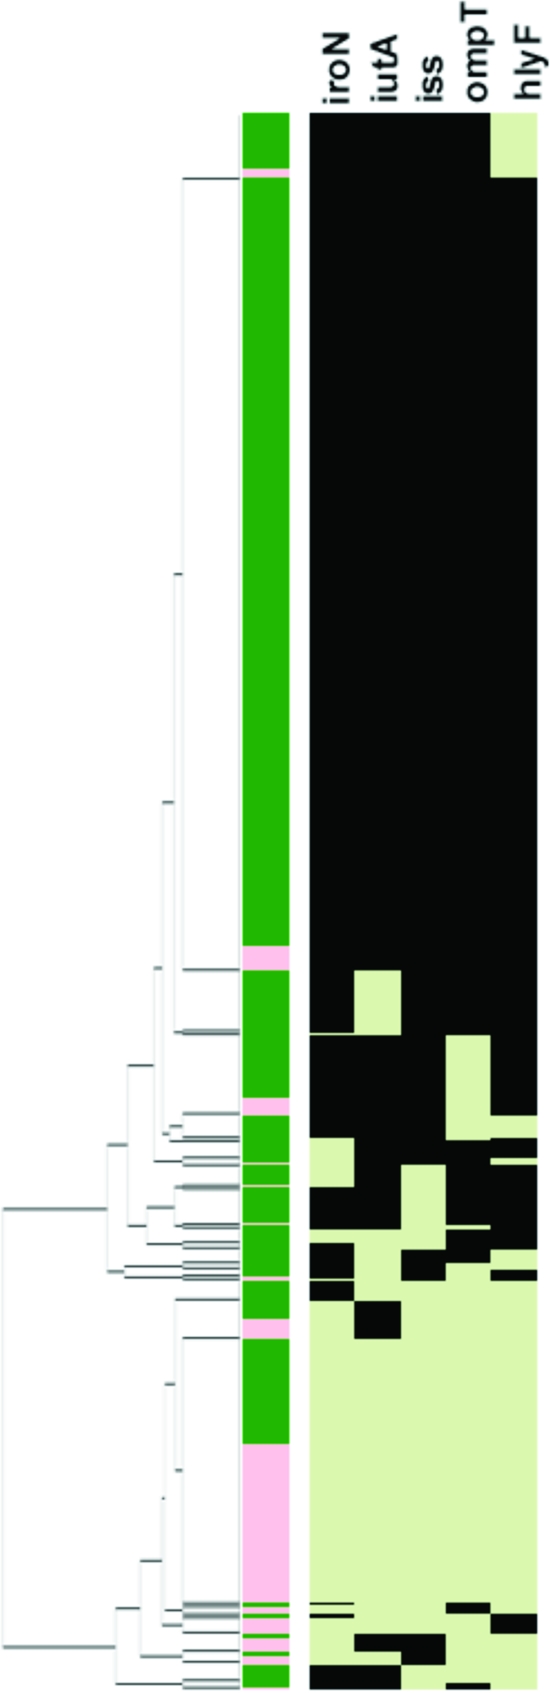
Results using the pentaplex panel for the 994 avian E. coli isolates. The left-most portion of this figure is the dendrogram resulting from the cluster analysis. Just to the right of the dendrogram is column 1, which identifies an isolate as APEC (green) or AFEC (pink). Columns 2 to 6 show the virulence genotype of each isolate tested for iroN, iutA, iss, ompTp, and hlyF. Each column in this group shows the results for a single gene. Black indicates that the gene is present, and light green indicates that the gene is absent.