
FIG. 4.
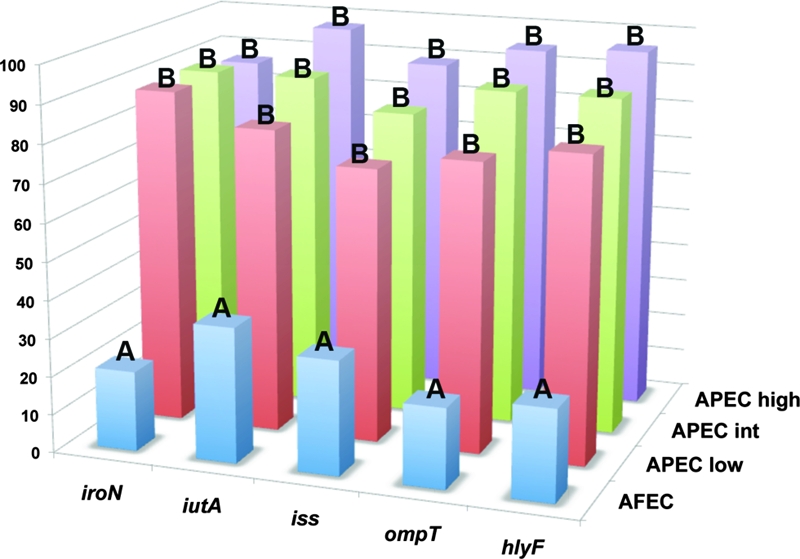
Histogram comparing the prevalence of the genes targeted in the pentaplex procedure among APEC isolates of known pathogenicity (APEC high, high pathogenicity [n = 73]; APEC int, intermediate pathogenicity [n = 26]; APEC low, low pathogenicity [n = 25]). Also shown is the gene prevalence among 200 AFEC isolates. Letters above bars indicate levels of statistical significance according to Fisher's exact test (P < 0.05 is considered statistically significant).