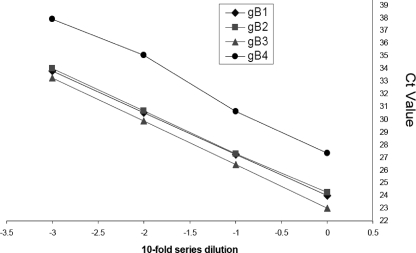
FIG. 3.
CT values of four gB genotypes under identical RT-GQ-PCR conditions were assessed by using 10-fold serial dilutions of clinical samples. The correlation between the noise band crossing points and a serial 10-fold dilution revealed a good negative linear relationship for all four genotypes. Diamonds: gB1, slope = −3.280, intercept = 23.982, R2 = 0.999. Squares: gB2, slope = −3.283, intercept = 24.153, R2 = 0.999. Triangles: gB3, slope = −3.424, intercept = 23.016, R2 = 0.999. Circles: gB4, slope = −3.424, intercept = 22.926, R2 = 0.989.

