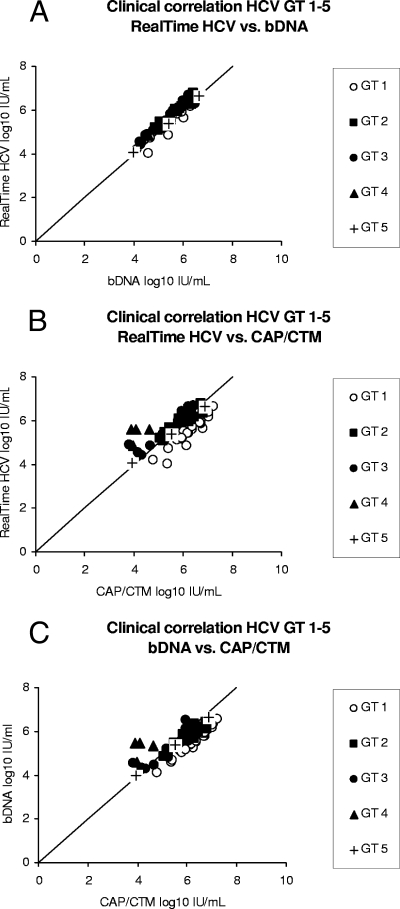
FIG. 1.
Correlation of the results for clinical specimens (n = 65) from patients with chronic HCV infection, as assessed by direct comparison of the results of RealTime HCV versus those of the bDNA assay (A), the results of RealTime HCV versus those of CAP/CTM (B), and the results of CAP/CTM versus those of the bDNA assay (C). The different genotypes (GTs) are represented by different symbols.

