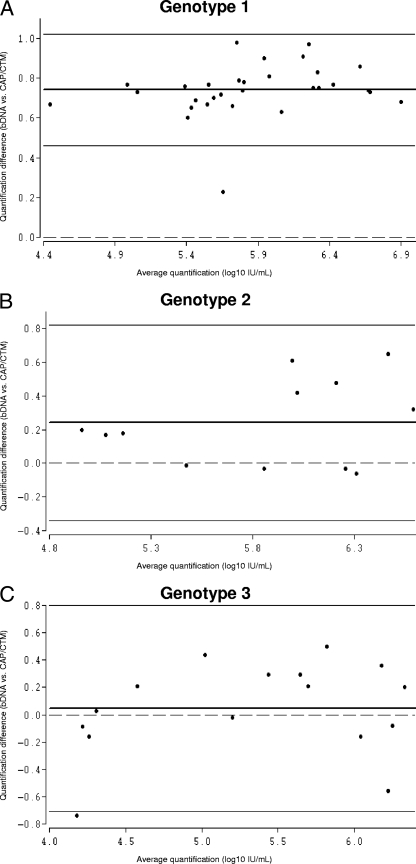
FIG. 4.
Bland-Altman analysis of genotype-specific mean differences in HCV RNA quantification by CAP/CTM versus that the bDNA assay. Due to the relatively low number of samples harboring genotypes 4 and 5, Bland-Altman analysis was performed only for genotypes 1 (A), 2 (B), and 3 (C). The bold lines represent the mean differences for the samples, the thin lines represent the 95% limits of agreement, and the dashed lines are the reference lines.

