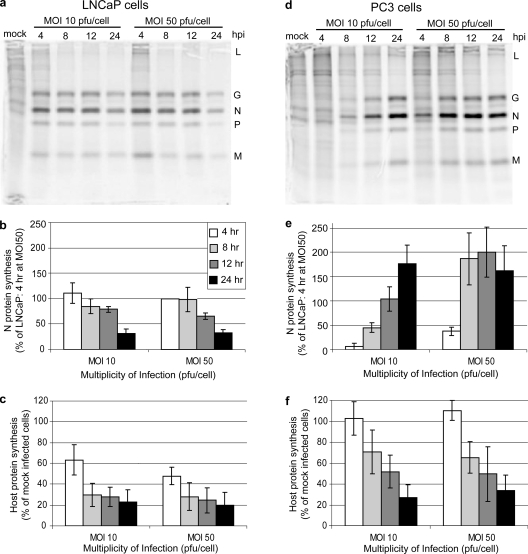
FIG. 6.
Analysis of protein synthesis in PC3 and LNCaP cells infected with VSV. Both LNCaP (a, b, and c) and PC3 (d, e, and f) cells were infected at MOIs of 10 and 50 PFU/cell. At various times postinfection cells were labeled with [35S]methionine. Lysates were analyzed by SDS-PAGE and phosphorescence imaging (a and d). Viral proteins are indicated to the right of each gel. The radioactivity of the VSV N protein bands was quantified and is shown for LNCaP cells in panel b and for PC3 cells in panel e. The radioactivity of background host protein synthesis (taken from three sections of each lane that exclude viral protein bands) was quantified and is shown for LNCaP cells in panel c and for PC3 cells in panel f. Relative to LNCaP cells, there is a delay in viral protein synthesis in PC3 cells, but it is similar to the delay seen in primary transcription.

