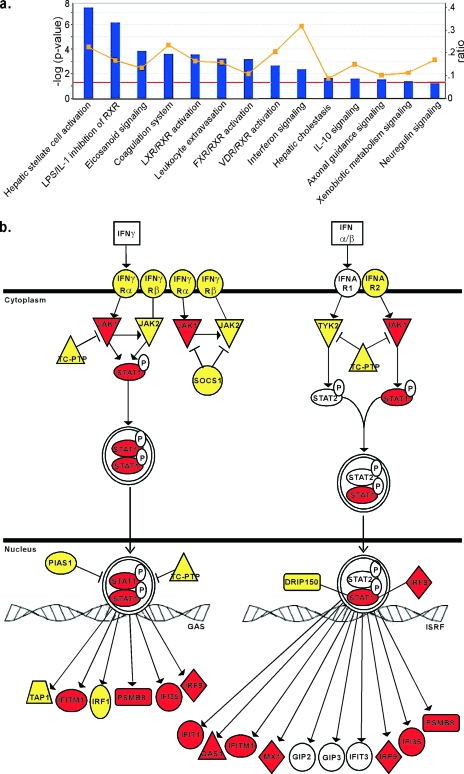
FIG. 7.
IPA analysis of differential mRNA expression in LNCaP and PC3 cells reveals constitutive expression of many antiviral mRNAs in PC3 cells. Microarray analysis of mock-infected LNCaP and PC3 cells was performed, and mRNA levels in the two cell types were further analyzed by IPA software. (a) The genes that were expressed differentially between LNCaP and PC3 cells were analyzed for association with any of 80 canonical pathways and are sorted according to their statistical significance of association (bars; red line indicates a P value of <0.05). The yellow line indicates the fraction associated with each pathway of genes that were expressed differentially between LNCaP and PC3 cells (right y axis). The IFN signaling pathway stands out with the highest fraction of differentially expressed genes. (b) The IFN signaling pathway genes. Red indicates genes that were overexpressed in PC3 cells relative to LNCaP cells. Yellow indicates genes that were present at similar levels in both cells types. Genes shown in white were present in the microarray library, but their signal levels were not detected above background. There were no genes in this pathway that were overexpressed in LNCaP cells relative to PC3 cells.

