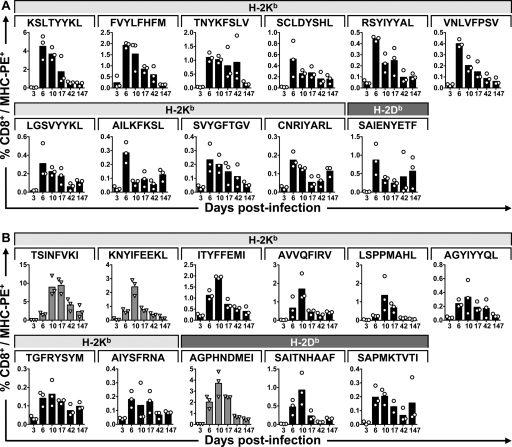
FIG. 5.
CD8 T-cell response to MHV-68. Cell surface staining with the respective H-2Kb and H-2Db tetramers at different time points after infection. The panels show the epitopes according to the division of the respective CD8 T-cell responses into an earlier response with a peak at 6 dpi (A) and a later response with the peak at 10 dpi (B). Data shown represent three individual mice per time point. PE, phycoerythrin.

