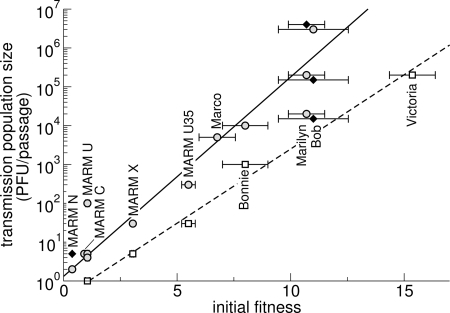
FIG. 1.
TPS versus initial fitness of the VSV strain. Symbols represent the fitness change after 20 passages: open squares, significant fitness loss; gray circles, no significant fitness change; filled diamonds, significant fitness gain. Data for Bob are moved slightly to the lower right because otherwise they overlap with data for Marilyn. TPS is the CBS for data represented as gray circles, because those correspond to regimens in which there was not a fitness change. We set our significance level to an α value of 0.05 and corrected for multiple testings using the false-discovery-rate correction (1, 2). The solid line is the best linear fit of initial fitness versus log transmission size for gray circles, and the dashed line represents the same for open squares.

