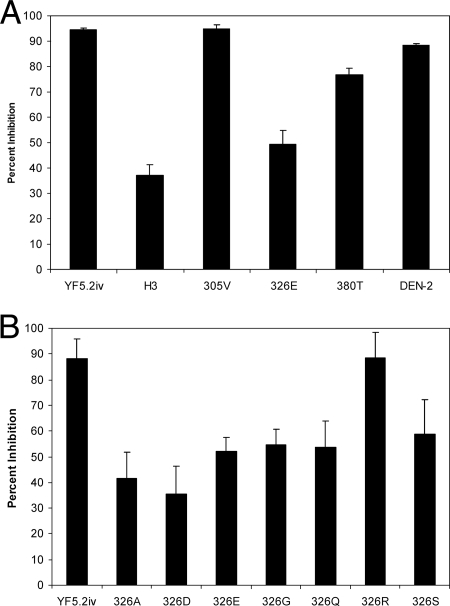
FIG. 4.
Heparin inhibition of YFV plaque formation. The values represent means plus standard deviations. (A) SPYF-specific substitutions in domain III. The results represent data from four independent experiments. Statistical values for differences in heparin inhibition were as follows (P values of <0.05 were considered significant): YF5.2iv versus SPYF-H3, 326E, 380T, or DEN-2 (dengue 2 virus), P < 0.0001; YF5.2iv versus 305V, P = 0.815; 305V versus 380T, P = 0.001; 305V versus 326E or SPYF-H3, P < 0.001; 305V versus DEN-2, P = 0.004; 380T versus SPYF-H3, P < 0.001; 380T versus 326E, P = 0.002; 380T versus DEN-2, P = 0.002; SPYF-H3 versus 326E, P = 0.117; SPYF-H3 versus DEN-2, P < 0.001; 326E versus DEN-2, P < 0.001. (B) Viruses containing substitutions at position 326. The results represent data from six independent experiments. Statistical values for differences in heparin inhibition were as follows (P values of <0.05 were considered significant): YF5.2iv versus 326A, 326G, 326D, 326Q, 326S, or 326E, P < 0.0001; YF5.2iv versus 326R, P = 0.964; 326E versus 326R, P < 0.0001; 326E versus 326D, P = 0.007; 326E versus 326G, P = 0.470; 326E versus 326A, P = 0.046; 326E versus 326S, P = 0.30; 326E versus 326Q, P = 0.766; 326D versus 326R, P < 0.0001; 326D versus 326G, P = 0.003; 326D versus 326A, P = 0.336; 326D versus 326S, P = 0.008; 326D versus 326Q, P = 0.013; 326A versus 326R, P < 0.0001; 326A versus 326G, P = 0.021; 326A versus 326S, P = 0.032; 326A versus 326Q, P = 0.065; 326G versus 326Q, P = 0.828; 326G versus 326S, P = 0.526; 326Q versus 326S, P = 0.480; 326Q versus 326R, P < 0.0001.

