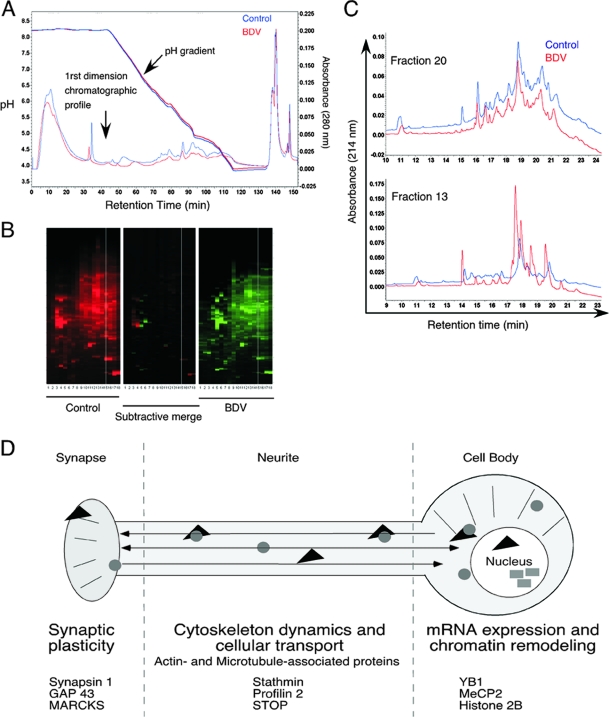
FIG. 2.
Comparative analysis of the chromatograms between control and BDV-infected neuronal extracts. (A) Reproducibility of the pH gradients during the first dimension of automated 2D-LC. The pH gradients of the chromatofocusing steps for control (blue curves) and BDV-infected (red curves) samples as well as their chromatographic profiles are displayed on the same graph to illustrate the overlap between the two fractionation experiments. (B) Overview of the protein maps obtained after fractionation. The x axis of the 2D-LC map displays fractionation according to pI values, and the y axis displays increasing hydrophobicity. Each UV peak is represented by a horizontal band, whose intensity is proportional to the height of the peak. The center map is a differential map corresponding to a point-to-point subtraction of corresponding lanes from the control (red) and BDV-infected (green) maps, revealing fractions presenting differently expressed proteins between samples. (C) Representative examples of the comparison of 2D-LC chromatograms. Two chromatograms obtained after second-dimension fractionation using first-dimension fractions 20 (top) and 13 (bottom) are shown. Fraction 20 is representative of a chromatogram profile that was very similar between BDV and control samples and for which no fraction was selected for subsequent protein identification by MS. Fraction 13 is representative of a profile for which significant differences were noted. In this case, fractions collected between retention times of 17 and 21 min were selected for MS/MS analysis. (D) Schematic overview of the main neuronal proteome changes identified following infection of primary neurons with BDV. Changes were arbitrarily regrouped into three main functional categories, for which several examples of proteins are given.

