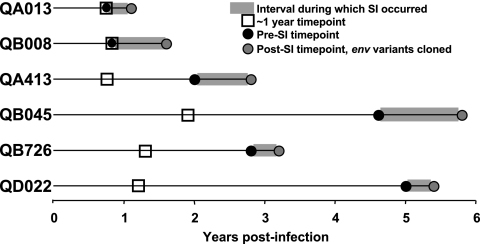
FIG. 1.
Timing of analyzed samples for the six superinfection cases. Each of the six superinfection cases is identified on the left, with a horizontal line indicating the time since the initial infection, according to the scale at the bottom. The interval during which superinfection occurred is indicated by the gray bar. The ∼1-year time point from which plasma samples were evaluated is indicated by the open squares, and the presuperinfection time point is indicated by the black circles. For subjects QA013 and QB008, the ∼1-year time point and the presuperinfection time point were the same since superinfection occurred at approximately 1 year. The gray circles indicate the first time point at which the superinfecting variants were identified; all env variants were cloned from this time point. SI, superinfection.

