FIG. 2.
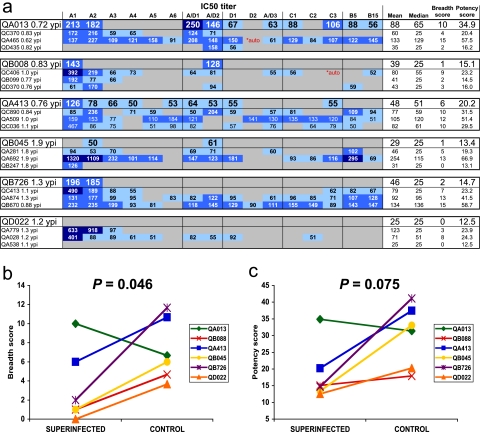
NAb responses at approximately 1 ypi. (a) The plasma samples tested are displayed along the left, with a subject identification code followed by the number of years postinfection at which the plasma sample was obtained. Each superinfection case is displayed in larger font at the top of a group, with the three matched controls in the box beneath. The 16 viruses tested are shown at the top, followed by a column for the mean, median, breadth score, and potency scores for each plasma sample (four rightmost columns). The 16 panel viruses are abbreviated by subtype along the top. The virus variants are: A1, Q461d1; A2, Q168b23; A3, Q842d16; A4, BJ613.E1; A5, BS208.B1; A6,Q769b9; A/D1, BF535.A1; A/D2, QA790.204I.ENV.C1; D1, QD435.100 M.ENV.A4; D2, QA465.59 M.ENV.D1; A/D3, QZ100.ENV.D83; C1, Du156.12; C2,QB099.391 M.ENV.C8; C3, QC406.70 M.ENV.F3; B5, 6535.3; B15, THRO4156.18. IC50 values are shown as numerical values in the table. The data are color coded, with darker blue boxes denoting more potent neutralization. A gray bar indicates that <50% neutralization was observed at a plasma dilution of 1:50, which was the highest dilution tested. For the purposes of statistical analyses, these IC50 values were assigned a level of 25. The two values marked “*auto” in red indicate that the plasma sample was autologous to the panel virus and was therefore not included in calculation of the breadth and potency scores. (b) Comparison of breadth scores between superinfection cases and the average value from the three matched controls for each case. Breadth scores are shown along the y axis, and the superinfecting and control groups are compared along the x axis. The lines between the data points denote comparison between the superinfection cases and the matched controls. P values for the superinfection cases compared to controls were obtained by comparing scores with the Wilcoxon signed ranks test. (c) Comparison of potency scores, displayed as per breadth scores in panel b.

