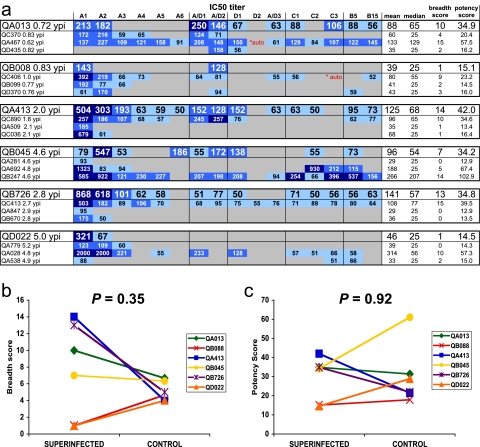
FIG. 3.
NAb responses immediately prior to superinfection. (a) IC50 values for plasma/virus combinations are presented as described in the legend to Fig. 2a. Here, the viruses tested are the same as in the experiment shown in Fig. 2, but the plasma tested was from a different time point, i.e., the time point immediately prior to documented superinfection. (b) Comparison of breadth scores between superinfection cases and matched controls prior to superinfection as described in the legend of Fig. 2b. (c) Comparison of potency scores between superinfection cases and matched controls prior to superinfection as described in the legend of Fig. 2c.

