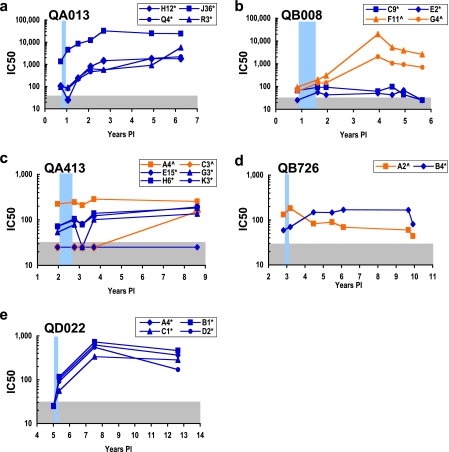
FIG. 5.
Neutralization of superinfecting and initial variants by plasma from the superinfected individuals. Each panel represents the evolving NAb response in the superinfected subject indicated in the upper left. The autologous plasma IC50 value against the various initial and superinfecting env variants is plotted over time. Superinfecting variants are denoted with blue symbols, and initial variants are indicated with orange symbols. All the env variants were cloned from the time point immediately after superinfection, and the light-blue bars denote the interval in which superinfection occurred. The gray bar indicates the limit of detection of our assay. When a virus was neutralized <50% at a plasma dilution of 1:50, the highest dilution tested, the IC50 value was assigned a level of 25 and is within the gray area. PI, postinfection.

