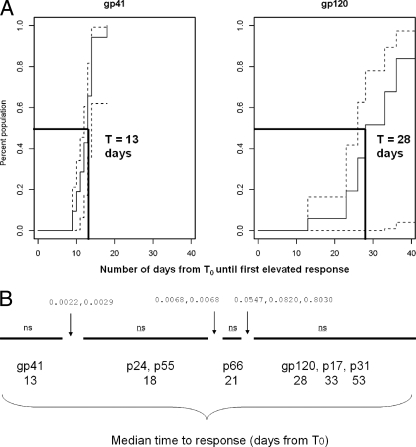
FIG. 2.
(A) Kaplan Meier plot of anti-gp41 and anti-gp120 antibody responses in the eclipse phase clade B plasma donor cohort. The solid line shows the increasing percentage of the population that develops HIV-specific antibody responses at each time interval following the calculated T0. The dashed lines indicate the upper and lower point-wise confidence intervals, respectively. (B) Pairwise comparison of the timing of anti-Env antibody responses compared anti-Gag (p24, p17, and p55) and anti-Pol (p31) responses in the eclipse phase clade B plasma donor cohort. The solid line (from left to right) indicates the median day of antibody elevation from T0, and the gaps in the line indicate the HIV-specific antibody responses that group together relative to their time of elevation from T0. The values above the lines are q values for pairwise tests of differences between adjacent groups of antibody specificities. ns, no statistically significant pairwise difference within the group of antibody specificity. The median time for appearance of IgG anti-gp41 antibody was 13.5 days (A), while the median time for appearance of IgG gp120 antibody was 28 days (B).

