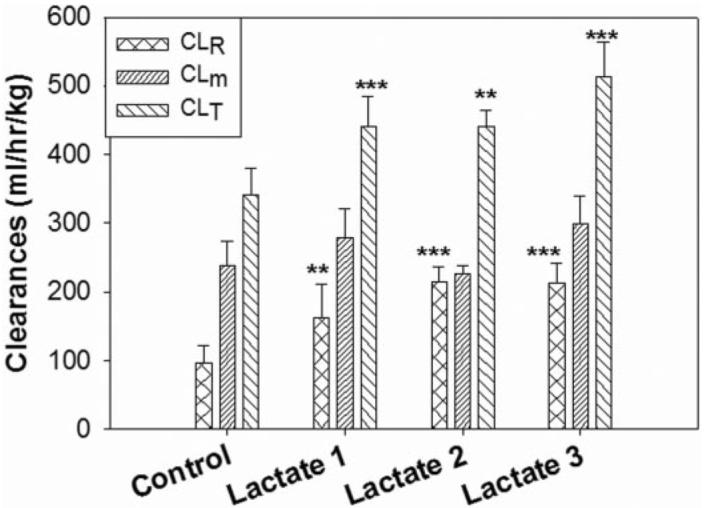
Fig. 1.

The renal clearance (CL R), metabolic clearance (CLm), and total clearance (CLT) of GHB determined after the infusion of different doses of L-lactate. The control was administered GHB (208 mg/kg/h) alone. L-Lactate-1, L-lactate-2, and L-lactate-3 represent the doses of 60.5, 121, and 302.5 mg h−1 kg−1, respectively. Results are plotted as mean ± S.D., n = 3 to 5. Statistical differences were compared with the control (**, p < 0.01; ***, p < 0.001), using a one-way ANOVA followed by a Dunnett's post hoc test.
