
Fig. 3.
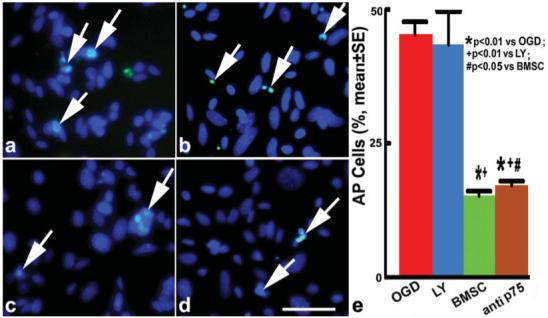
TUNEL staining after 3 hr of post-OGD incubation. The green fluorescein labels apoptotic OLG nuclei, the blue fluorescein OLG nuclei. Arrows indicate apoptotic OLGs in the OGD-OLG group (a), LY-OLG group (b), BMSC-OLG group (c), and anti-p75-OLG group (d). Quantification of OLG apoptosis (e): the apoptotic OLGs were significantly decreased after coculture with BMSCs or anti-p75 blocking antibody treatment compared with the OGD group (P < 0.01). Scale bar = 50 μm.