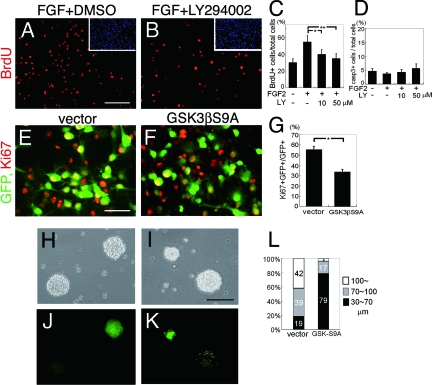
FIG. 2.
Involvement of PI3K activation and GSK3β Ser9 phosphorylation in the proliferation of neural precursor cells in response to FGF2. (A to D) FGF2 (10 ng/ml) increased the number of BrdU+ cells (red in panel A), and LY294002 abolished this effect in a dose-dependent manner (B). DMSO, dimethylsulfoxide. (C) Ratio of BrdU+ cells/total cells (n = 4; *, P < 0.01; **, P < 0.001; Student's t test). (D) Ratio of active caspase 3+ (casp3+) cells/total cells (n = 4). (E to G) Ki67+ proliferative cells (red in panels E and F) were less frequent among GSK3βS9A-expressing cells (green in panel F) than among control GFP virus-infected cells (green in panel E). (G) The ratio of Ki67+ cells/GFP+ cells (n = 5; *, P < 0.01 compared to values for the control; Student's t test). All of these experiments were done with cells seeded at a high density (3.2 × 10⁵ cells/cm2). (H to L) Misexpression of GSK3βS9A significantly decreased the diameter of primary neurospheres (green sphere in panel K) compared to that of the control (green sphere in panel J; also see the corresponding uncolored spheres in panels H and I). Yellow dots seen in panel K are artifacts caused by the reflection of the lights from clean benches. (L) Summary of results (n = 4). Scale bar for panels A and B, 100 μm. Scale bar for panels E and F, 50 μm. Scale bar for panels H to K, 100 μm.

