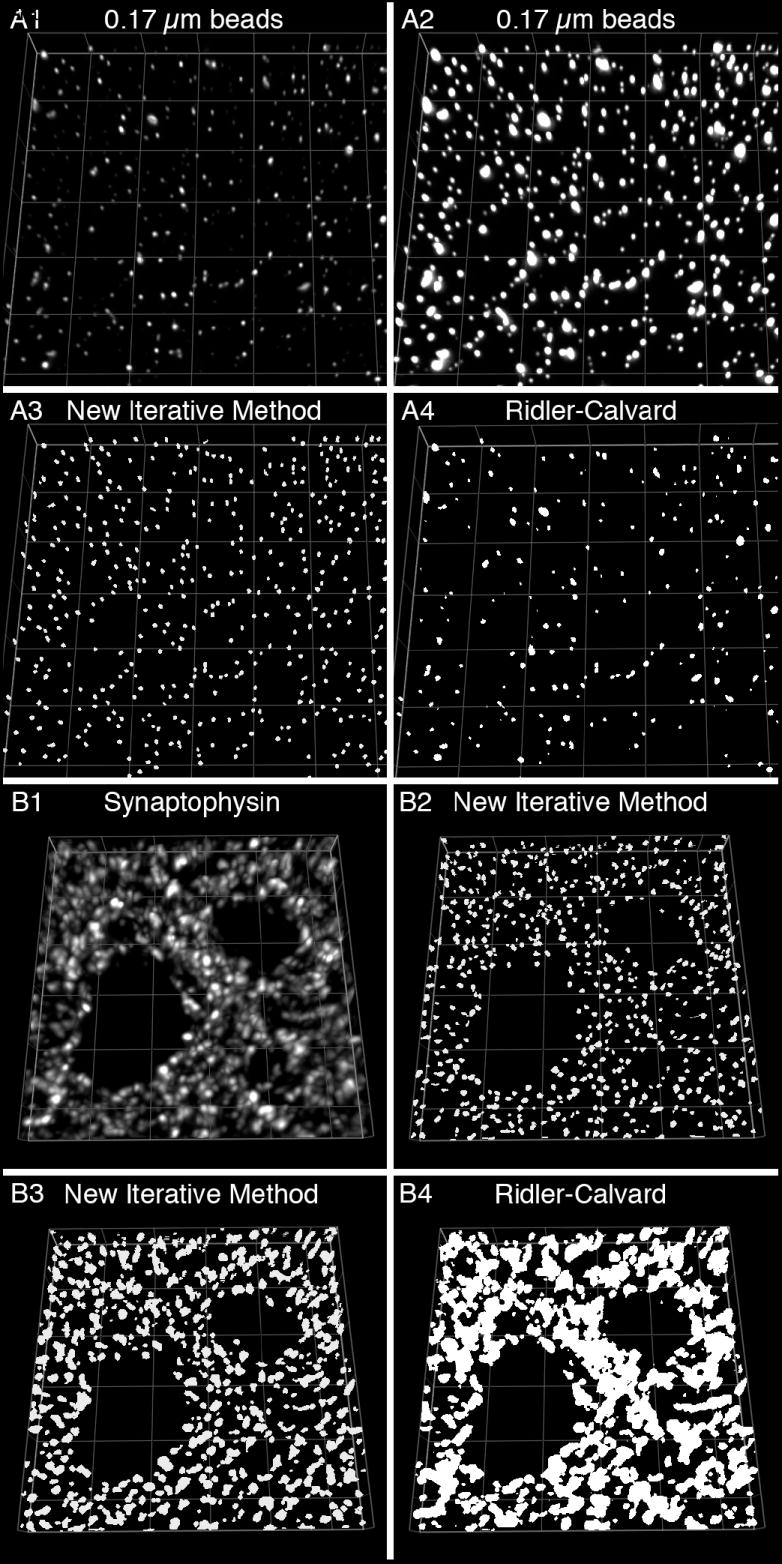
Figure 1. Segmentation of IR puncta using repetitive intensity and morphological gating.

(A) 0.17 μm diameter fluorescently labeled microspheres of varying intensity were mounted on a slide for observation. (A1-A2) Two projection images of the same 11 z-planes (step size = 0.1 μm) from a deconvolved image stack are presented using different intensity values. (A3-A4) The data in A1 were segmented using a new iterative method (A3; see main text for protocol) or the automated Ridler-Calvard technique available in SlideBook 4.2 (A4). (B) Cryostat sections (40 μm) were labeled for synaptophysin. (B1) Projection image of a deconvoled image stack (11 z-planes taken 0.25 μm apart). The data were segmented using our segmentation methodology with a morphological range of 0.0125 to 0.1 μm3 (B2) or 0.0125 to 0.5 μm3 (B3), or using the Ridler-Calvard algorithm (B4). Grid size = 5 μm.
