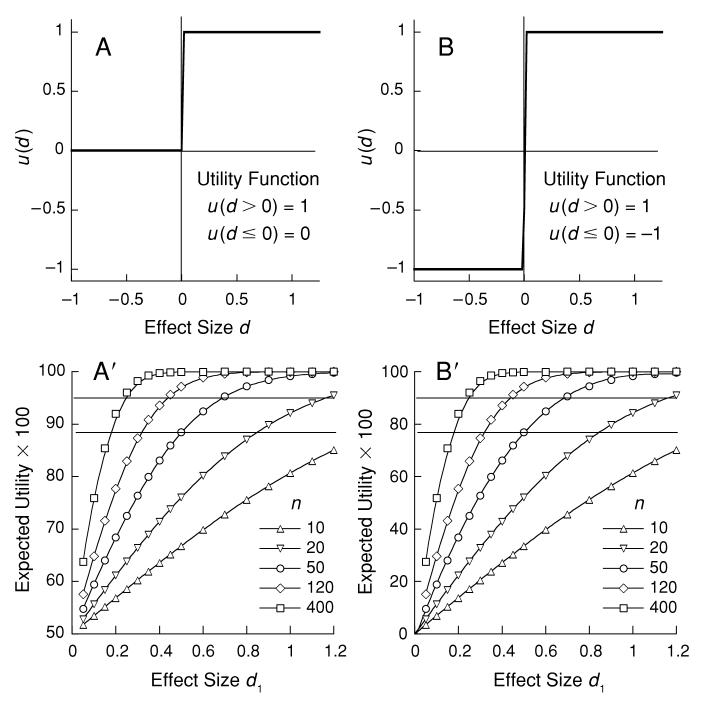
Figure 2.
Utility functions and the corresponding expected utility of results below them. Left: The step function returns an expected value of prep, the probability of observing d2 > 0 in replication. The intersection of the curves with the criterion lines marks the first combination of n and d1 to achieve significance at α ≤ .05 (lower criterion) or α ≤ .01 (upper criterion). Right: A symmetric utility function yielding a set of expected values shown in panel B′ that are congruent with those in panel A′. Note the change of scale, with origin now at 0.

