
Figure 4.
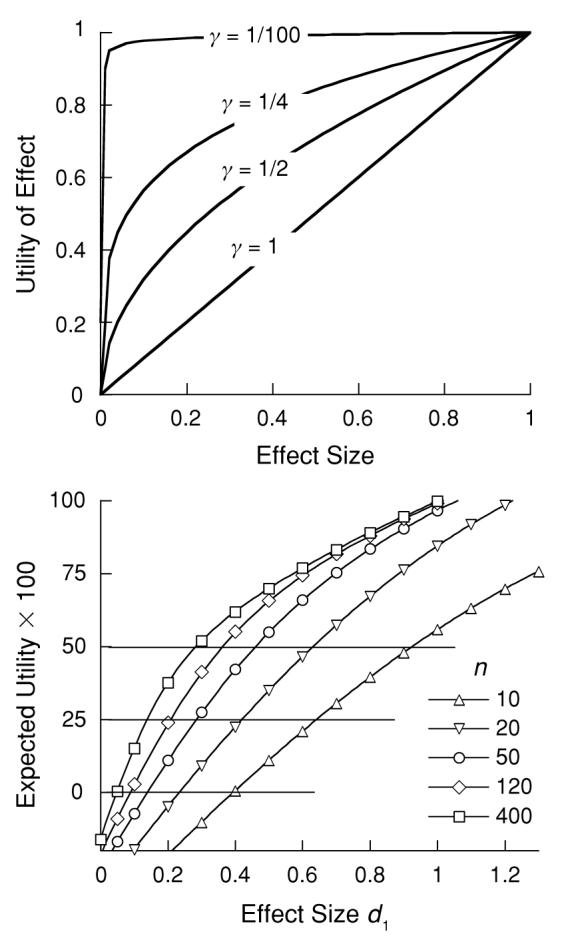
The utility functions in the top panel range from one representing current practice of placing extreme weight on replicability (γ = 1/100) to one that places extreme weight on effect size (γ = 1). The bottom panel shows the expected value of experiments resulting when the utility function is γ = ½ and the cost of false positives is c = 2. The horizontal lines represent criteria appropriate to different opportunity costs.