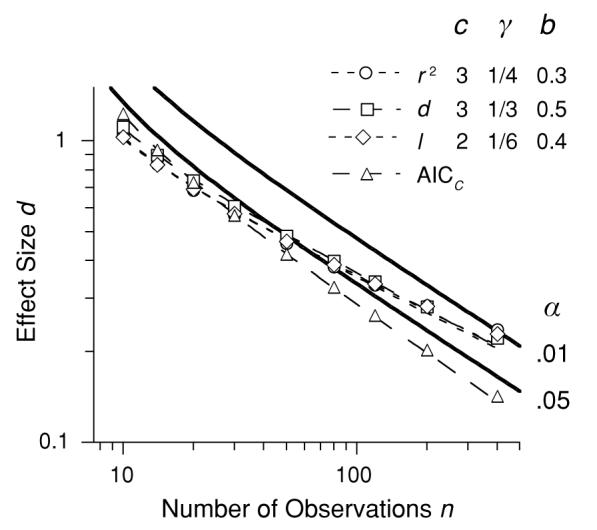
Figure 6.

The continuous lines represent traditional criteria (γ = 0). The symbols show combinations of d and n that satisfy various costs for false positives (c), and utility gradients (γ), on the coefficient of determination (r2), effect size (d), K–L distance (I ), and the Akaike information criterion (AICc). Note that all may be emulated by utility functions on effect size and by Equation 3 (dashed lines).
