Abstract
A strong premature electrical stimulus (S2) induces both virtual anodes and virtual cathodes. The effects of virtual electrodes on intracellular Ca2+ concentration ([Ca2+]i) transients and ventricular fibrillation thresholds (VFTs) are unclear. We studied 16 isolated, Langendorff-perfused rabbit hearts with simultaneous voltage and [Ca2+]i optical mapping and for vulnerable window determination. After baseline pacing (S1), a monophasic (10 ms anodal or cathodal) or biphasic (5 ms-5 ms) S2 was applied to the left ventricular epicardium. Virtual electrode polarizations and [Ca2+]i varied depending on the S2 polarity. Relative to the level of [Ca2+]i during the S1 beat, the [Ca2+]i level 40 ms after the onset of monophasic S2 increased by 36 ± 8% at virtual anodes and 20 ± 5% at virtual cathodes (P < 0.01), compared with 25 ± 5% at both virtual cathode-anode and anode-cathode sites for biphasic S2. The VFT was significantly higher and the vulnerable window significantly narrower for biphasic S2 than for either anodal or cathodal S2 (n = 7, P < 0.01). Treatment with thapsigargin and ryanodine (n = 6) significantly prolonged the action potential duration compared with control (255 ± 22 vs. 189 ± 6 ms, P < 0.05) and eliminated the difference in VFT between monophasic and biphasic S2, although VFT was lower for both cases. We conclude that virtual anodes caused a greater increase in [Ca2+]i than virtual cathodes. Monophasic S2 is associated with lower VFT than biphasic S2, but this difference was eliminated by the inhibition of the sarcoplasmic reticulum function and the prolongation of the action potential duration. However, the inhibition of the sarcoplasmic reticulum function also reduced VFT, indicating that the [Ca2+]i dynamics modulate, but are not essential, to ventricular vulnerability.
Keywords: electrical stimulation, mapping
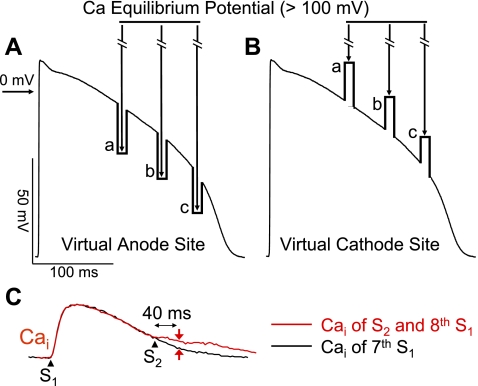
the demonstration of virtual electrode formation after a premature stimulus (S2) given through small epicardial electrodes has provided novel insights into the mechanisms of ventricular vulnerability (7, 15). A virtual cathode is a region with a transient depolarization of membrane potential (Vm), whereas a virtual anode is a region with a transient hyperpolarization of Vm during S2. While virtual electrode formation was initially demonstrated by applying near-field stimulation to small epicardial electrodes, the same phenomenon was also shown in bidomain computer simulation studies (13) and after defibrillation shocks to rabbit ventricles (2). In addition to the effects on Vm, a strong electrical stimulus can also significantly change the intracellular Ca2+ concentration ([Ca2+]i) (4). The magnitude and the spatial distribution of these changes are in part determined by the timing of the shock (10). Because heterogeneous postshock [Ca2+]i changes are important in the mechanisms of ventricular defibrillation (6), it is important to study the differential effects of virtual anodes and cathodes on [Ca2+]i release to better understand the mechanisms of reinduction of VF following defibrillation. As illustrated in Fig. 1, transient hyperpolarization at virtual anodes is expected to increase the driving force for Ca2+ entry through L-type Ca2+ channels (Fig. 1A), potentiating sarcoplasmic reticulum (SR) Ca2+ release. In contrast, transient depolarization at virtual cathodes is not expected to exert this effect (Fig. 1B), resulting in lesser SR Ca2+ release. The magnitude of change is increased with the increasing coupling interval (a, b, and c). These opposite effects are expected to increase the heterogeneity of [Ca2+]i distribution. In contrast, after a biphasic S2, the sites serving as virtual anodes during the first phase of the pulse became virtual cathodes during the second phase, and vice versa. Thus a biphasic shock would be expected to have more uniform effects on SR [Ca2+]i release. If [Ca2+]i transient heterogeneity is important in the mechanisms of ventricular vulnerability, then the induction of ventricular fibrillation (VF) should be easier with monophasic than with biphasic S2. We hypothesize that 1) after a strong S2 stimulus, virtual anodes cause a greater increase in [Ca2+]i than virtual cathodes, and 2) the monophasic S2 is associated with lower VF threshold (VFT) than biphasic S2, but this difference is eliminated by the inhibition of SR function. The purpose of the present study was to test these hypotheses by simultaneously mapping Vm and [Ca2+]i transients at virtual cathodes and virtual anodes during monophasic and biphasic epicardial point (near field) stimulation in Langendorff-perfused rabbit ventricles.
Fig. 1.
Schematics illustrating the proposed hypothesis. A: action potential negatively polarized at virtual anode. B: depolarization at virtual cathode. Since Ca2+ equilibrium potential (ECa) is >60 mV, the driving force for Ca2+ entry through L-type Ca2+ channels is increased at virtual anodes but decreased at virtual cathodes. The increased Ca2+ entry triggers additional sarcoplasmic reticulum (SR) Ca2+ release, potentiating the intracellular Ca2+ concentration ([Ca2+]i) transient selectively at virtual anodes but not at virtual cathodes. The potentiation of SR Ca2+ release at virtual anodes is also greater at longer stimulus (S2) coupling intervals (a, b, and c in A and B) when SR Ca2+ release channels have had more time to recover from refractoriness. C: methods for measuring Δ[Ca2+]i. The difference of the [Ca2+]i amplitude (Δ) was measured 40 ms after the S2.
METHODS
The research protocol was approved by the Institutional Animal Care and Use Committee of Cedars-Sinai Medical Center and followed the guidelines of American Heart Association.
Tissue preparation.
New Zealand White rabbits (n = 18) weighing 3–5 kg were used in this study. The rabbits were anesthetized. The hearts were quickly removed. The ascending aorta was cannulated and secured for retrograde perfusion with warm (36.5 ± 0.5°C) and oxygenated Tyrode solution at a rate of 30–40 ml/min. The composition of the Tyrode solution (in mmol/l) at a pH of 7.4 ± 0.05 was 125 NaCl, 4.5 KCl, 1.8 NaH2PO4, 24 NaHCO3, 1.8 CaCl2, 0.5 MgCl2, and 5.5 glucose and 50 mg/l albumin in deionized water. The coronary perfusion pressure was regulated and maintained at 80 cmH2O, and the hearts were exposed to the air.
Stimulation protocol.
Two stimulating electrodes were placed on the left ventricle for baseline pacing (cathodal S1) at a cycle length of 350 ms and for monophasic or biphasic S2 stimulation 10–12 mm away using a World Precision Instrument (Sarasota, FL) model A385R constant current isolator. The line connecting S1 and S2 sites was parallel to the epicardial fiber orientation. The stimulating electrodes were made of stainless steel wires that were Teflon-coated except at their tips and had a diameter of 0.20 mm. We performed an in vitro testing and confirmed that a maximum of 60 mA of current can be delivered to the rabbit hearts with this stimulation system. After eight S1 stimulations, a S2 was applied with a stimulus strength ranging from 1 to 60 mA. The S2 polarity was either monophasic or biphasic. The total pulse duration for either monophasic or biphasic S2 was 10 ms. A 4-cm2-size mesh of stainless wire situated on the left ventricular posterior wall was used as the reference electrode. The biphasic S2 was anode-cathode or cathode-anode. Each phase of the biphasic S2 was 5 ms. The strength of the S2 current was changed in 10-mA increments. The effective refractory period at the S2 site was defined as the longest S1-S2 during which a cathodal stimulus of 10-ms duration and twice the diastolic threshold current did not initiate a propagated action potential.
The vulnerable window and the VFT.
The vulnerable window and the VFT were determined in 10 rabbits by giving S2 with strengths of 1 to 60 mA. The shortest coupling interval that induced VF was determined by scanning the diastole starting with 60-ms S1-S2 coupling interval with 10-ms increments at a fixed S2 strength. The longest coupling interval that induced VF was determined by scanning the diastole starting with 240-ms S1-S2 coupling interval with 10-ms decrements at a fixed S2 strength. A defibrillation shock was used to terminate VF. The vulnerable window for that S2 strength was defined as the duration between the shortest and the longest coupling interval that induced VF. After the shortest and the longest S1-S2 coupling intervals were determined, we did not apply S2 at the in-between S1-S2 coupling intervals to minimize the fibrillation/defibrillation episodes that might cause tissue damage. We defined the area on the strength-interval curve associated with the induction of VF as the area of vulnerability. In 6 out of 10 hearts, we administered 1 μM ryanodine and 100 nM thapsigargin to inhibit SR Ca2+ cycling. The VFT was determined again by scanning the S1-S2 coupling interval starting from 80 ms with 10-ms increment and starting from 340 ms with 10-ms decrement at a fixed S2 strength for the shortest and the longest coupling interval that induced VF, respectively. The S2 strength varied from 1 to 60 mA.
Optical mapping.
Eight hearts were labeled for simultaneous dual optical mapping of Vm and [Ca2+]i according to methods described in detail elsewhere (9). A Ca2+-sensitive dye (0.5 mg Rhod-2 AM, Molecular Probes) was infused into the heart over a 10-min period. This was followed in 15 min by a direct injection of a voltage-sensitive dye (RH 237, Molecular Probes) into the perfusion system with 10–20 μl of the 1 mg/ml solution dissolved in dimethyl sulfoxide (1). The hearts were illuminated with a solid-state, frequency-doubled laser (Verdi, Coherent). The fluorescence was acquired simultaneously with two charge-coupled device cameras (CA-D1-0128T, Dalsa) at 4 ms/frame. The digital images (128 × 128 pixels) were gathered from the epicardium of the left ventricle (20 × 20 mm2 area) at 1,000 frames continuously with a 12-bit resolution. Optical signals were processed with both spatial (3 × 3 pixels) and temporal (3 frames) filtering. We used a grid to calibrate the locations of the field of view of these two cameras. Using this calibration, we can compare the recordings of Vm and [Ca2+]i from the same locations. Cytochalasin D (5 μmol/l, Sigma) was added to the perfusate to inhibit muscle contraction.
Construction and interpretation of two-dimensional maps.
The ratio maps were used to examine Vm activation and changes of [Ca2+]i levels. The average fluorescence level (F̄) of the entire data window was first calculated. The fluorescent level of each pixel was then compared with this average. We assigned shades of red to represent above-average fluorescence and shades of blue to represent below-average fluorescence to generate the ratio maps.
Data analysis.
We assumed that the S1-induced action potential has a resting Vm of −75 mV and a maximum phase 0 upstroke of +15 mV. The fluorescent intensity of [Ca2+]i transient was normalized from 0 (end diastolic) to 1 (peak systolic). The Δ[Ca2+]i amplitude, representing the net change of [Ca2+]i after S2 stimulus compared with 7th S1-paced beat, was measured 40 ms after S2 (Fig. 1C). We chose to measure 40 ms after S2 because 40 ms was sufficiently long to allow Ca2+-induced SR Ca2+ release to occur, but sufficiently short to prevent measuring the secondary [Ca2+]i rise triggered by a propagated action potential in case the S2 captured the ventricle.
Statistical analysis.
Statistical differences in Δ[Ca2+]i amplitudes were tested with a two-way ANOVA. Differences among individual means were verified subsequently by Newman-Keuls post hoc tests. VFT and the S1-S2 coupling interval of the vulnerable window were compared by one-way ANOVA with Newman-Keuls multiple comparisons for post hoc analysis. P ≤ 0.05 was considered significant. All data are presented as means ± SD.
RESULTS
Virtual electrodes and [Ca2+]i after a monophasic and biphasic S2.
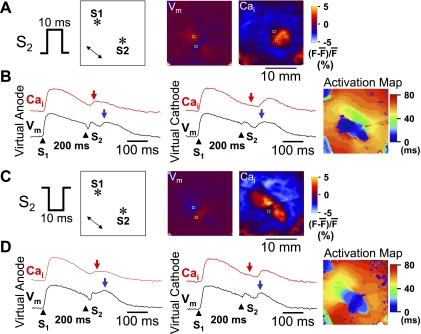
Consistent with previous studies (8, 11, 15), our optical recordings showed coexistence of virtual anode and virtual cathode after monophasic S2 in all hearts studied. Fig. 2A shows virtual electrode formation after a monophasic anodal S2. The Vm map shows a dog bone-shaped virtual anode perpendicular to the fiber orientation and two virtual cathodes located parallel to the fiber orientation. The simultaneous [Ca2+]i map shows [Ca2+]i elevation around the S2, corresponding to the dog bone-shaped virtual anode, but no significant [Ca2+]i elevation at the surrounding virtual cathodes. Figure 2B shows Vm and [Ca2+]i tracings from virtual anode and virtual cathode sites, respectively. At 40 ms after the S2 (red arrowheads in the [Ca2+]i trace), before the secondary [Ca2+]i transient elicited by propagated action potentials from the S2 (blue arrowheads in the Vm trace), [Ca2+]i was elevated at the virtual anode site, but not at the virtual cathode site. An activation isochronal map of the propagated response induced by S2 is shown on the right.
Fig. 2.
Differential [Ca2+]i dynamics at virtual electrodes induced by a monophasic S2. A: S2 polarity (anodal) and the location of stimulation electrodes in the mapped region. A double-headed arrow indicates the direction of epicardial fiber orientation. The membrane potential (Vm) map shows virtual electrode polarizations after a 60-mA, 10-ms monophasic anodal S2 given 200 ms after the last S1. The [Ca2+]i map was taken 40 ms after the S2. B: optical recordings at virtual anode and virtual cathode, respectively. Red arrows indicate 40 ms after S2. Blue arrows indicate the peak of a regenerative action potential. C: S2 polarity (cathodal) and the location of stimulation electrodes in the mapping region. The Vm map shows virtual electrode polarizations after a 60-mA, 10-ms monophasic cathodal S2 given 200 ms after the last S1. The [Ca2+]i map shows the [Ca2+]i distribution, which was taken 40 ms after the S2. D: optical recordings at virtual anode and virtual cathode, respectively. *Location of the tip of the electrode. F, fluorescence.
In comparison, a monophasic cathodal S2 induced a pair of virtual anodes parallel to the fiber orientation and a dog bone-shaped virtual cathode transverse to the fiber orientation (Fig. 2C). At 40 ms after S2, there was larger [Ca2+]i elevation at virtual anode than at virtual cathode sites. The region of [Ca2+]i elevation corresponded directly to the shape of the virtual anode region. Figure 2D shows Vm and [Ca2+]i tracings from virtual anode and virtual cathode, respectively. There was [Ca2+]i elevation 40 ms after S2 (red arrowheads) at the virtual anode site but not at the virtual cathode site. The [Ca2+]i elevation at virtual anode occurred before the peak of propagated Vm (blue arrowheads). An activation isochronal map of the propagated response induced by S2 is shown on the right.
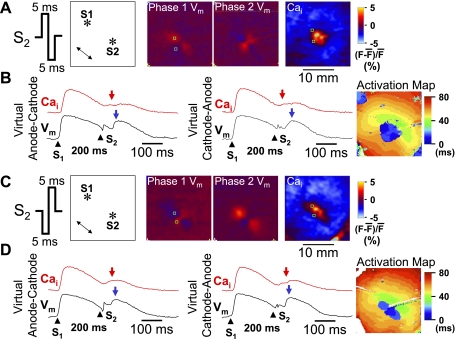
Figure 3 shows the effects of an anodal-cathodal biphasic S2 (anodal pulse in the first phase and cathodal pulse in the second phase). Figure 3A shows that the virtual electrode polarizations induced by the first phase of S2 reversed polarity immediately following the second phase of S2. The [Ca2+]i map 40 ms after S2 showed [Ca2+]i elevation around the site of the S2, but the shape did not resemble either the virtual anode or virtual cathode regions on the Vm map, and the size of [Ca2+]i elevation by anodal-cathodal S2 was smaller than that by anodal S2 shown in Fig. 2A. Figure 3B shows Vm and [Ca2+]i tracings from a virtual anode-cathode site and a virtual cathode-anode site, respectively. There was similar [Ca2+]i elevation 40 ms after S2 (red arrow) at these two sites. The [Ca2+]i elevation at either site (red arrowheads) occurred before the peak of propagated Vm (blue arrowheads). An activation isochronal map of the propagated response induced by S2 is shown on the right.
Fig. 3.
[Ca2+]i dynamics after a biphasic S2. The Vm maps in A show virtual electrode polarizations induced by anodal and cathodal phases, respectively. The S2 was a 60-mA, 10-ms biphasic S2 given 200 ms after the last S1. The [Ca2+]i map shows the [Ca2+]i distribution, 40 ms after the S2. B: optical recordings at virtual anode-cathode and virtual cathode-anode, respectively. Red arrows indicate 40 ms after S2. Blue arrows indicate the onset of regenerative action potential. C: S2 polarity and the location of stimulation electrodes in the mapped region. The Vm maps show virtual electrode polarizations induced by cathodal and anodal phases, respectively. The S2 was a 60-mA, 10-ms biphasic S2 given 200 ms after the last S1. The [Ca2+]i map was taken 40 ms after the S2. D: optical recordings at virtual anode-cathode and virtual cathode-anode, respectively. *Location of the tip of the electrode.
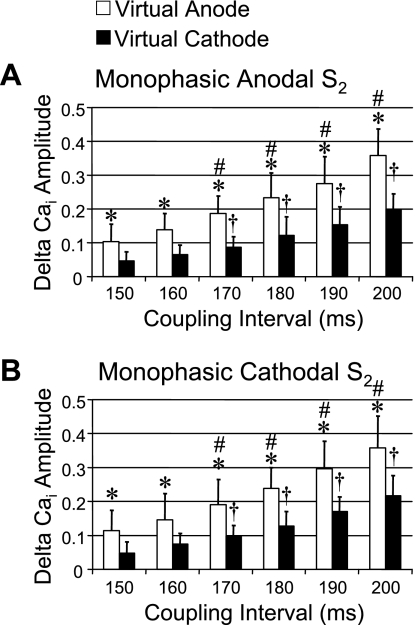
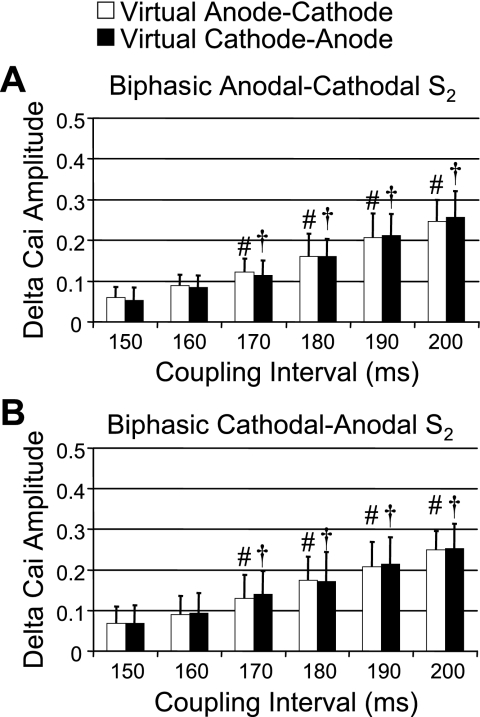
Figure 3, C and D, shows the patterns of [Ca2+]i and Vm when the biphasic waveform of the S2 was switched to the first-phase cathodal and second-phase anodal (cathodal-anodal). An activation isochronal map of the propagated response induced by S2 is shown on the right of Fig. 3D. When compared with the effects of the anodal-cathodal S2 (Fig. 3A), the virtual electrodes reversed their polarity during the two phases (Fig. 3A). Figures 4 and 5 summarize the average changes in the level of [Ca2+]i for both monophasic and biphasic S2 delivered over a range of S1-S2 coupling intervals. Monophasic cathodal and anodal S2 elevated [Ca2+]i to a substantially greater extent at virtual anode sites compared with virtual cathode sites (Fig. 4), and the differences were larger with longer S1-S2 coupling intervals. In contrast, these differences were greatly attenuated with anodal-cathodal or cathodal-anodal biphasic S2 shocks (Fig. 5).
Fig. 4.
Δ[Ca2+]i amplitudes between virtual anodes and virtual cathodes at different S1-S2 coupling intervals. A: Δ[Ca2+]i amplitude (net increase in [Ca2+]i by S2 stimulation compared with 7th S1-paced beat) at virtual anode and virtual cathode when S2 was monophasic anodal. The Δ[Ca2+]i amplitudes progressively and significantly increased with increasing coupling interval. B: Δ[Ca2+]i amplitude at virtual anode (white bars) and virtual cathode (black bars) induced by monophasic cathodal S2. *P < 0.01 when compared with Δ[Ca2+]i amplitude at virtual cathode. #P < 0.01 and †P < 0.01 when compared with Δ[Ca2+]i amplitude of virtual anode and virtual cathode, respectively, at the S1-S2 coupling interval of 150 ms.
Fig. 5.
Comparison of Δ[Ca2+]i amplitudes between virtual anode-cathode and virtual cathode-anode after biphasic S2 stimulation. A: Δ[Ca2+]i amplitudes after anodal-cathodal biphasic S2. There was no significant difference of Δ[Ca2+]i amplitudes between the 2 virtual electrode sites. However, there was progressive increase in Δ[Ca2+]i amplitude with increasing S1-S2 coupling intervals. B: similar results of Δ[Ca2+]i amplitude after cathodal-anodal biphasic S2. The Δ[Ca2+]i amplitude in both A and B progressively increased with increasing S1-S2 coupling intervals but did not show a significant difference between virtual anode-cathode (white bars) and virtual cathode-anode (black bars). #P < 0.01 and †P < 0.01 when compared with Δ[Ca2+]i amplitude of virtual anode-cathode and virtual cathode-anode, respectively, at the S1-S2 coupling interval of 150 ms.
Different areas of vulnerability of monophasic S2 and biphasic S2.
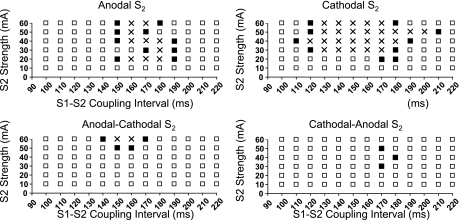
Figure 6 shows the typical areas of vulnerability of monophasic and biphasic S2 from one heart. The black squares show S2 stimulus that induced VF, whereas the white squares show S2 stimulus that failed to induce VF. No S2 was given at the location marked by cross marks. These graphs show that the areas of vulnerability were much larger for monophasic than biphasic S2 in this heart. Both monophasic anodal and cathodal S2 induced VF in all 10 rabbits tested. However, VF was not inducible by either biphasic anodal-cathodal and cathodal-anodal S2 at any S2 strength in 3 of 10 hearts. In the remaining seven hearts, VF was inducible by both monophasic and biphasic S2. The VFTs in these seven rabbits for monophasic S2 were 23 ± 5 (anodal) and 19 ± 7 mA (cathodal) [P = not significant (NS)]. For biphasic S2, the VFTs were 44 ± 10 (anodal-cathodal) and 40 ± 15 mA (cathodal-anodal) (P = NS). However, the differences between monophasic VFTs and biphasic VFTs were statistically significant (P < 0.01) for all comparisons.
Fig. 6.
Strength-interval plots of ventricular fibrillation (VF) induction at baseline. Shown are S2 trials that induced VF (▪); S2 trials that failed to induce VF (□), and S2 between the shortest and the longest coupling intervals that induced VF (×). To minimize the number of fibrillation/defibrillation episodes, we did not actually deliver these S2 to the ventricles. Ordinate (in mA) is S2 current strengths; abscissa is coupling intervals (in ms).
In contrast to VFT, the upper fibrillation threshold (UFT) did not show a significant difference between monophasic and biphasic S2. The UFT is defined by the highest stimulus strength that induced VF during the vulnerable period. VF was induced by 60-mA monophasic anodal or cathodal S2 shocks in all rabbits tested, indicating that UFT was >60 mA. Similarly, the UFT for anodal-cathodal S2 was >60 mA in all seven hearts, and the UFT for cathodal-anodal S2 was >60 mA in all seven hearts except for one of which UFT was 50 mA. Therefore, we were not able to compare the mean UFT between monophasic and biphasic S2.
The shortest coupling interval that induced VF averaged 130 ± 21, 120 ± 24, 151 ± 18, and 149 ± 21 ms for anodal, cathodal, anodal-cathodal, and cathodal-anodal S2 shocks, respectively, and the longest coupling interval that induced VF averaged 177 ± 17, 183 ± 18, 180 ± 8, and 181 ± 22 ms, respectively. In seven hearts, VF was inducible by both monophasic and biphasic S2. In these hearts, the maximum width of the vulnerable window [the difference of the longest and the shortest S1-S2 coupling interval that induced VF was 46 ± 18 for monophasic anodal S2 and 74 ± 25 ms for monophasic cathodal S2 (P < 0.01)]. The maximum width of the vulnerable window for biphasic S2 were 29 ± 12 (anodal-cathodal) and 29 ± 29 ms (cathodal-anodal, P = NS). The differences between vulnerable windows of the monophasic S2 and biphasic S2 were statistically significant (P < 0.01) for all comparisons. These findings indicate that the area of vulnerability is smaller for biphasic S2 than for monophasic S2.
Effects of thapsigargin and ryanodine on area of vulnerability.
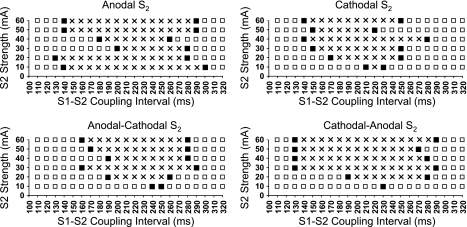
Pretreatment with thapsigargin and ryanodine largely eliminated the [Ca2+]i transient, so that [Ca2+]i mapping was not feasible. Thapsigargin and ryanodine treatment significantly prolonged the action potential duration (APD) compared with control (255 ± 22 vs. 189 ± 6 ms, P < 0.05). Thapsigargin and ryanodine eliminated the differences in VFT between monophasic and biphasic S2 shocks. Figure 7 shows area of vulnerability of monophasic and biphasic S2 shocks after thapsigargin and ryanodine from the same tissue shown in Fig. 6. The area of vulnerability widened after the treatment. Of note, there was a significant reduction of VFT (P < 0.01) after the treatment compared with baseline (monophasic anodal S2, 5.8 ± 2.0; monophasic cathodal S2, 6.7 ± 2.6; biphasic anodal-cathodal S2, 6.7 ± 2.6; and biphasic cathodal-anodal S2, 6.7 ± 2.6 mA), but no significant differences of VFT were detected among these four types of S2. The UFT was >60 mA for both monophasic and biphasic S2 in all rabbits tested. The shortest coupling interval that induced VF after thapsigargin and ryanodine was similar (127 ± 19, 127 ± 21, 135 ± 26, and 128 ± 18 ms for anodal, cathodal, anodal-cathodal, and cathodal-anodal S2, respectively) to baseline; however, the longest coupling interval increased significantly (P < 0.01, respectively) after treatment (232 ± 64, 237 ± 34, 223 ± 36, and 228 ± 42 ms for anodal, cathodal, anodal-cathodal, and cathodal-anodal S2, respectively).
Fig. 7.
Strength-interval plots of VF induction after the treatment of thapsigargin and ryanodine. Symbols and layout are as in Fig. 6.
DISCUSSION
The primary findings of this study are as follows: 1) a monophasic S2 elevates [Ca2+]i to a greater extent at virtual anodes than at virtual cathodes; 2) by switching the polarity in the middle of the pulse, a biphasic S2 attenuated the differences of [Ca2+]i and increased VFT; and 3) the depletion of SR Ca2+ stores with ryanodine and thapsigargin eliminated the VFT differences between monophasic and biphasic S2. However, these drugs also increased APD and decreased VFT for both monophasic and biphasic S2.
Mechanism of increased S2-induced [Ca2+]i transient heterogeneity by monophasic versus biphasic stimulus.
Figure 1 shows that at virtual anodes, the negative deflection of the membrane potential during the S2 increases the driving force (Ca2+ equilibrium potential −Vm) for Ca2+ entry through L-type Ca2+ channels, thereby potentiating SR Ca2+ release. At virtual cathodes, however, further membrane depolarization toward the Ca2+ equilibrium potential decreases the net driving force, resulting in failure to potentiate SR Ca2+ release to the same degree. For monophasic S2, this leads to heterogeneous [Ca2+]i elevation between the virtual anode and cathode regions. For biphasic S2, on the other hand, virtual anodes during the first phase become virtual cathodes during the second phase, and vice versa, so that the effect on SR Ca2+ release is more balanced. Another theoretical possibility, especially for a relatively late S2, is that membrane depolarization at the virtual cathode could reactivate recovered L-type Ca2+ channels, potentiating further SR Ca2+ release. However, we did not observe potentiation of the [Ca2+]i transient at virtual cathodes in this study.
SR Ca2+ cycling and ventricular vulnerability.
Coinciding with the greater [Ca2+]i heterogeneity induced by monophasic versus biphasic S2, we found that the VFT was significantly lower for monophasic S2 than for biphasic S2. Other investigators have demonstrated that enhancing L-type Ca2+ channel activity or α1-stimulation can reduce VFT (12, 16). These findings also suggest that SR function plays an important role in modifying the ventricular vulnerability. By inhibiting SR Ca2+ transient with thapsigargin and ryanodine, the APD increased significantly and the differences in VFT between monophasic and biphasic S2 disappeared. Our findings are consistent with the hypothesis that the [Ca2+]i transient heterogeneity is an important determinant of VFT. The relationship between [Ca2+]i and ventricular vulnerability can be partially explained by the bidirectional coupling between APD and [Ca2+]i (14). It is possible that the [Ca2+]i heterogeneity modulated the vulnerability to S2 through its influence on APD heterogeneity. A second possible explanation to link between [Ca2+]i and vulnerability is through afterdepolarization and triggered activity. Our laboratory (5) recently demonstrated the presence of [Ca2+]i prefluorescence at the entrance of the central common pathway of S2-induced figure-eight reentry. These findings suggest early afterdepolarization as a possible mechanism of impulse initiation at that site. Consistent with these hypotheses, the inhibition of the SR function by thapsigargin and ryanodine eliminated the differences between monophasic and biphasic S2 on VFT. However, because SR inhibition did not eliminate ventricular vulnerability, these data also indicate that although the Ca2+ dynamics modulate vulnerability it is not the sole determinant of vulnerability to VF by a strong S2 stimulus.
Shock-induced [Ca2+]i changes in cultured neonatal rat myocytes.
Fast et al. (3) reported that in cultured neonatal rat myocytes, short-coupled shocks may transiently reduce [Ca2+]i at sites of both positive and negative Vm changes. Raman et al. (10) extended the observations by evaluating time-dependent changes of shock on Vm and [Ca2+]i in cultured neonatal rat cells. These results appear to be opposite to those obtained by us. However, those conclusions were based on the analyses of [Ca2+]i changes during the shock, whereas we analyzed the [Ca2+]i changes 40 ms after S2 stimulation. The example shown in Fig. 2 of the study by Raman et al. (10) in fact showed [Ca2+]i elevation in the postshock period. Furthermore, the postshock [Ca2+]i elevation was larger after an anodal shock than after a cathodal shock, and there was more [Ca2+]i elevation after a longer coupling interval than after a shorter coupling interval. Those postshock changes of [Ca2+]i transient were consistent with the results of the present study.
Limitations.
This study was performed using small epicardial wires to give S2. Because the stimulation electrodes are small, the current flow through these electrodes is insufficient in achieving defibrillation. Therefore, the results of these studies might not be applicable to defibrillation shocks. [Ca2+]i and fluorescence do not have a linear relationship. Therefore, the absolute values shown in Figs. 4 and 5 may not reflect the correct Δ[Ca2+]i levels at all coupling intervals. However, the relative values of [Ca2+]i induced by anodal and cathodal stimuli and by different S1-S2 coupling intervals remain valid. This limitation therefore does not invalidate the conclusion of the study.
GRANTS
This study was supported by National Heart, Lung, and Blood Institute Grants P01-HL-78931, R01-HL-R01-HL-78932, R01-HL-58533, R01-HL-66389, and R01-HL-71140; by Kawata, Laubisch, Price, Krannert, and Medtronic-Zipes endowments; and by American Heart Association Postdoctoral Fellowships (Western State Affiliate) 0225027Y and 0555057Y and National Scientist Development Grant 0335308N.
Acknowledgments
We thank Avile McCullen, Lei Lin, and Elaine Lebowitz for assistance.
The costs of publication of this article were defrayed in part by the payment of page charges. The article must therefore be hereby marked “advertisement” in accordance with 18 U.S.C. Section 1734 solely to indicate this fact.
REFERENCES
- 1.Choi BR, Salama G. Simultaneous maps of optical action potentials and calcium transients in guinea-pig hearts: mechanisms underlying concordant alternans. J Physiol 529: 171–188, 2000. [DOI] [PMC free article] [PubMed] [Google Scholar]
- 2.Efimov IR, Cheng Y, Van Wagoner DR, Mazgalev T, Tchou PJ. Virtual electrode-induced phase singularity: a basic mechanism of defibrillation failure. Circ Res 82: 918–925, 1998. [DOI] [PubMed] [Google Scholar]
-
3.Fast VG, Cheek ER, Pollard AE, Ideker RE. Effects of electrical shocks on Ca
 and Vm in myocyte cultures. Circ Res 94: 1589–1597, 2004. [DOI] [PubMed] [Google Scholar]
 - 4.Fast VG, Ideker RE. Simultaneous optical mapping of transmembrane potential and intracellular calcium in myocyte cultures. J Cardiovasc Electrophysiol 11: 547–556, 2000. [DOI] [PubMed] [Google Scholar]
- 5.Hayashi H, Kamanu SD, Ono N, Kawase A, Chou CC, Weiss JN, Karagueuzian HS, Lin SF, Chen PS. Calcium transient dynamics and the mechanisms of ventricular vulnerability to single premature electrical stimulation in Langendorff-perfused rabbit ventricles. Heart Rhythm 5: 116–123, 2008. [DOI] [PMC free article] [PubMed] [Google Scholar]
- 6.Hwang GS, Hayashi H, Tang L, Ogawa M, Hernandez H, Tan AY, Li H, Karagueuzian HS, Weiss JN, Lin SF, Chen PS. Intracellular calcium and vulnerability to fibrillation and defibrillation in Langendorff-perfused rabbit ventricles. Circulation 114: 2595–2603, 2006. [DOI] [PubMed] [Google Scholar]
- 7.Lin SF, Han J, Qian YW, Province RR, Sung J. Virtual electrodes in the termination of ventricular fibrillation in protective zones. Proc First Joint BMES/EMBS Conf 5: 55, 1999. [Google Scholar]
- 8.Lin SF, Roth BJ, Wikswo JP Jr. Quatrefoil reentry in myocardium: an optical imaging study of the induction mechanism. J Cardiovasc Electrophysiol 10: 574–586, 1999. [DOI] [PubMed] [Google Scholar]
- 9.Omichi C, Lamp ST, Lin SF, Yang J, Baher A, Zhou S, Attin M, Lee MH, Karagueuzian HS, Kogan B, Qu Z, Garfinkel A, Chen PS, Weiss JN. Intracellular Ca dynamics in ventricular fibrillation. Am J Physiol Heart Circ Physiol 286: H1836–H1844, 2004. [DOI] [PubMed] [Google Scholar]
-
10.Raman V, Pollard AE, Fast VG. Shock-induced changes of Ca
 and Vm in myocyte cultures and computer model: dependence on the timing of shock application. Cardiovasc Res 73: 101–110, 2007. [DOI] [PubMed] [Google Scholar]
 - 11.Sepulveda NG, Roth BJ, Wikswo JPJ. Current injection into a two-dimensional anisotropic bidomain. Biophys J 55: 987–999, 1989. [DOI] [PMC free article] [PubMed] [Google Scholar]
- 12.Thandroyen FT, Flint NS, Worthington MG, Opie LH. Arrhythmogenic action of alpha 1-adrenoceptor stimulation in normoxic rat ventricular myocardium: influence of nisoldipine, reduced extracellular Ca2+ and ryanodine. J Mol Cell Cardiol 19: 841–851, 1987. [DOI] [PubMed] [Google Scholar]
- 13.Trayanova N, Skouibine K, Moore P. Virtual electrode effects in defibrillation. Prog Biophys Mol Biol 69: 387–403, 1998. [DOI] [PubMed] [Google Scholar]
- 14.Weiss JN, Karma A, Shiferaw Y, Chen PS, Garfinkel A, Qu Z. From pulsus to pulseless: the saga of cardiac alternans. Circ Res 98: 1244–1253, 2006. [DOI] [PubMed] [Google Scholar]
- 15.Wikswo JP Jr, Wisialowski TA, Altemeier WA, Balser JR, Kopelman HA, Roden DM. Virtual cathode effects during stimulation of cardiac muscle. Two-dimensional in vivo experiments. Circ Res 68: 513–530, 1991. [DOI] [PubMed] [Google Scholar]
- 16.Worthington MG, Opie LH. Effects of calcium channel agonism by Bay-K-8644 on ventricular fibrillation threshold of isolated heart. Cardiovasc Drugs Ther 6: 597–604, 1992. [DOI] [PubMed] [Google Scholar]


