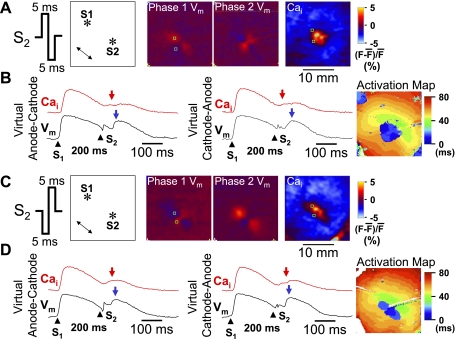
Fig. 3.
[Ca2+]i dynamics after a biphasic S2. The Vm maps in A show virtual electrode polarizations induced by anodal and cathodal phases, respectively. The S2 was a 60-mA, 10-ms biphasic S2 given 200 ms after the last S1. The [Ca2+]i map shows the [Ca2+]i distribution, 40 ms after the S2. B: optical recordings at virtual anode-cathode and virtual cathode-anode, respectively. Red arrows indicate 40 ms after S2. Blue arrows indicate the onset of regenerative action potential. C: S2 polarity and the location of stimulation electrodes in the mapped region. The Vm maps show virtual electrode polarizations induced by cathodal and anodal phases, respectively. The S2 was a 60-mA, 10-ms biphasic S2 given 200 ms after the last S1. The [Ca2+]i map was taken 40 ms after the S2. D: optical recordings at virtual anode-cathode and virtual cathode-anode, respectively. *Location of the tip of the electrode.

