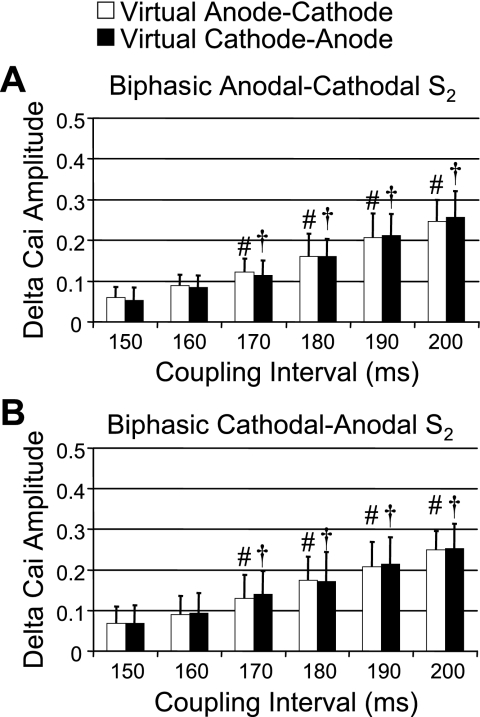
Fig. 5.
Comparison of Δ[Ca2+]i amplitudes between virtual anode-cathode and virtual cathode-anode after biphasic S2 stimulation. A: Δ[Ca2+]i amplitudes after anodal-cathodal biphasic S2. There was no significant difference of Δ[Ca2+]i amplitudes between the 2 virtual electrode sites. However, there was progressive increase in Δ[Ca2+]i amplitude with increasing S1-S2 coupling intervals. B: similar results of Δ[Ca2+]i amplitude after cathodal-anodal biphasic S2. The Δ[Ca2+]i amplitude in both A and B progressively increased with increasing S1-S2 coupling intervals but did not show a significant difference between virtual anode-cathode (white bars) and virtual cathode-anode (black bars). #P < 0.01 and †P < 0.01 when compared with Δ[Ca2+]i amplitude of virtual anode-cathode and virtual cathode-anode, respectively, at the S1-S2 coupling interval of 150 ms.

