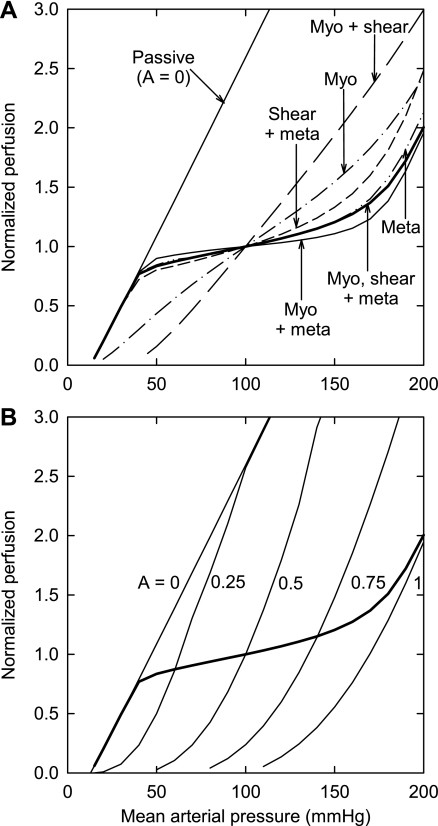
Fig. 2.
Predicted dependence of perfusion on arterial pressure. Perfusion is expressed relative to its value when mean arterial pressure equals 100 mmHg. A: passive results and results including active responses as indicated. B: results for constant activation levels: A = 0, 0.25, 0.5, 0.75, and 1. The predicted curve in the presence of all 3 regulatory mechanisms (heavy line) is also shown. Meta, metabolic; myo, myogenic.

