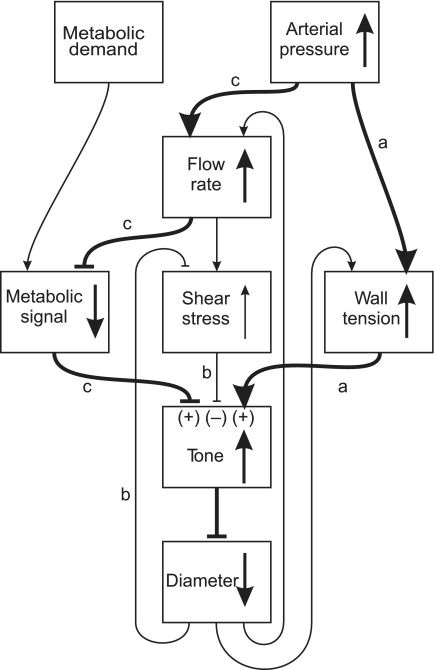
Fig. 6.
Schematic diagram illustrating interactions between factors involved in blood flow regulation. Heavy lines and arrows show the primary effects in the system. Blunt-ended arrows denote negative effects. Vertical arrows indicate effects of increasing arterial pressure in the presence of the myogenic, shear stress, and metabolic responses. Pathway a shows the vasoconstriction caused by increased wall tension. Pathway b shows the decrease in tone resulting from increased shear stress in the system. Pathway c shows the vasoconstrictor effect of the metabolic response in the presence of increased pressure and flow. (+) and (−), increase or decrease in tone, respectively, generated by each mechanism as a result of increased arterial pressure.

