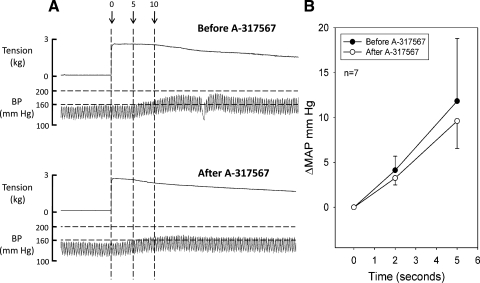
Fig. 5.
Pressor responses to static contraction at the onset of tension development before and 10 min after acid-sensitive ion channel (ASIC) blockade. A: muscle tension and BP responses to static contraction before (top traces) and 10 min after (bottom traces) A-317567 injection. Dashed vertical lines represent 3 time points: onset of tension development (0), 5 s, and 10 s. Horizontal dashed lines represent BP at 200 and 160 mmHg. Note that in the first 5 s of contraction A-317567 had no significant effect on the pressor response. B: changes in MAP during contraction at 2 and 5 s after the onset of tension development. •, before A-317567; ○, after A-317567. Note there were no significant differences in the pressor responses at either 2 or 5 s.

