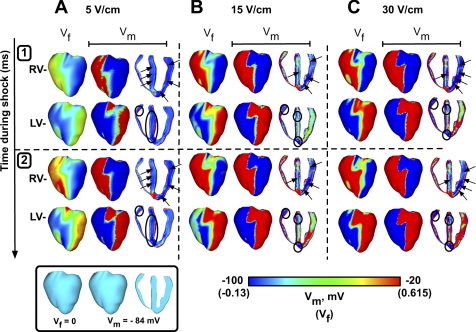
Fig. 5.
Simulation results for 5 (A), 15 (B), and 30 V/cm (C) for the first (top, 1) and second (bottom, 2) milliseconds following shock onset. For each shock strength and time, epicardial Vf (left) and both epicardial (middle) and transmural transmembrane potential (Vm; right) are shown for both RV− (top rows) and LV− shocks (bottom rows).

