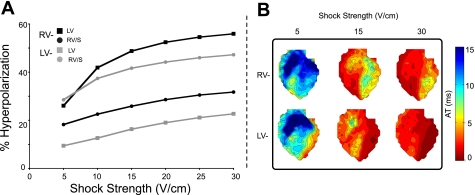
Fig. 6.
A: regional tissue volume of hyperpolarization, assessed as a percentage of the total regional tissue volume, as a function of shock strength for the numerical simulations. B: experimental isochrone maps for shock strengths of 5, 15, and 30 V/cm for both RV− (top row) and LV− (bottom row) shocks. RV/S, RV and septum.

