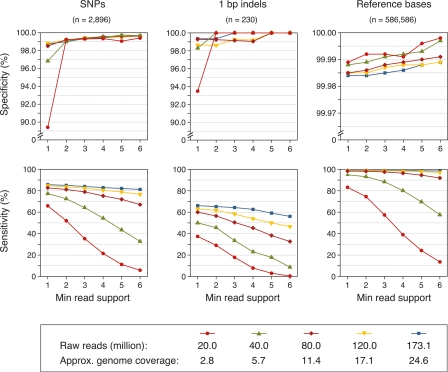
Figure 2.
Performance evaluation for sequence predictions from aligned reads. Specificity (top) and sensitivity (bottom) for Bur-0 by genome coverage depth (see legend) for a range of minimum read supports. Approximate genome coverage estimates for each subsample of the data are based on the data in Table 1 (see also Supplemental Methods).

